

A viral post last week posited the existence of the ‘London banana’ – a belt sweeping through the west of the capital where ‘you’ll have a great time’.
Israel-based journalist Saul Sadka boldly claimed ‘almost everything outside the area’, stretching from Barnet down towards leafy Richmond-upon-Thames, ‘is horrible’.
Last week, having poured over all of the available data, the Daily Mail found there was some truth behind the fiercely debated banana hypothesis. Schools performed better inside the corridor, homes were more expensive and adults claimed to be healthier.
Now, armed with the same figures, we can unpeel the existence of a ‘rotten banana’ – a stretch of north east London which typically ranks towards the bottom of the same tables on crime, deprivation, health and house prices.
It runs through parts through parts of Enfield, Haringey and Waltham Forest, south through Hackney and Tower Hamlets, then curves north-easterly through to Newham, Barking, and Dagenham and Havering.
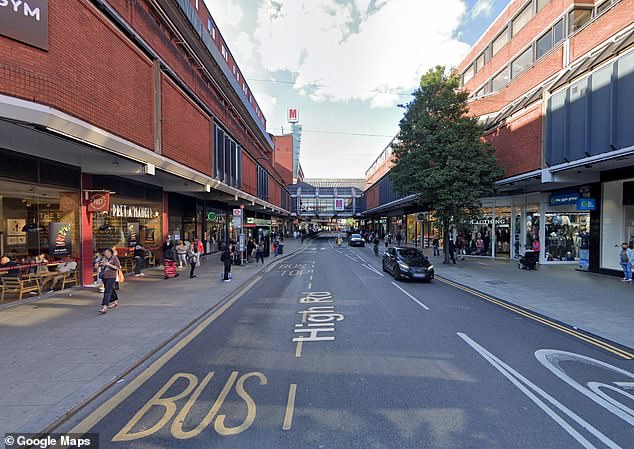
The Haringey neighbourhood ‘016A’, which includes this section of Wood Green High Road is in London’s ‘rotten banana’ had the worst combined score on our series of tests on crime rates, house prices, health and deprivation
When all our metrics were combined for London’s 5,000 LSOAs (lower layer super output areas) – tiny neighbourhoods home to around 2,000 people – the capital’s worst-ranked area was a pocket of Haringey which encompass parts of Wood Green High Road and Pelham Road.
House prices cost a median average of just £240,500 in the Haringey 016A LSOA last year.
This was in the bottom 1.8% of all areas in the capital, according to the Mail’s analysis of Land Registry data.
By comparison, the average house price in London last year was around £550,000 – and stood north of £8million in mansion-lined streets of Hampstead Heath.
A total of 9.4% of people in the Haringey 016A area reported being in ‘bad’ or ‘very bad’ health in the 2021 Census.
All but 0.7% of LSOAs scored better on that metric.
Some 71% of households were deprived in at least some way, according to official figures, putting it in the bottom 4% of neighbourhoods.
The crime rate was also amongst the highest in London, with a rate of 517 crimes or anti-social behaviour reports per 1,000 residents in the year to June.
That put it in the top 1.5% of the near 5,000 LSOAs across the London boroughs and the City.
Crime
Perhaps unsurprisingly, given it covers Oxford Street and Covent Garden, London’s original banana was typically home to the highest crime rates.
Outside of Westminster and the City of London, however, figures show the highest crime rate was in Stratford neighbourhood home to the Westfield shopping centre, well within our rotten banana.
The LSOA, called Newham 039D, saw 3,311 crime reports per 1,000 residents in the year to June.
However, this area scored well on all our other metrics, including health and house prices, meaning it didn’t rank dead last on our overall scoring system.
House prices
Although the neighbourhood with the lowest house prices was located the other side of the capital, miles away from our rotten banana, swathes of the corridor were in the bottom 10%.
On the southern curve, the neighbourhood of Newham 042D, on the Royal Wharf of Silvertown, had a median sold price of £99,950 – the second lowest in London, just behind a pocket of Ealing where fees sat at around £80,000.
Another suburb of the rotten banana with atypically low house prices was Stamford Hill, Hackney. The average price paid in this neighbourhood was just £112,500 last year, according to our analysis.
However, as with many of the metrics assessed by the Mail, Redbridge fared better than surrounding boroughs.
Health/Deprivation
Like with the other metrics, there was a clear divide on the map for health, with many of the areas faring worst located in the centre on the banana.
For example, 10.3% of residents in Hackney 024D in Dalston, were in poor health at the time of the Census. More than 99% of London’s LSOAs had a lower figure.
Some of the worst deprivation seen in London was inside the confines of the rotten banana, too.
The neighbourhood of Haringey 013D, at Broadwater Farm, just outside the Lordship Recreation Ground, found itself in the top 0.1% of London’s most deprived areas. Some 80.7% of households there suffer from at least one form of deprivation.
Many areas of Enfield, Waltham Forest, Havering, Newham and Barking and Dagenham, Hackney and Tower Hamlets had rates of deprivation well above 60 and 70%.


