

London homeowners have seen the value of their properties increase over the past month – despite a nationwide downward trend in house prices.
UK property values suffered a month-on-month fall of nearly 3 per cent in today’s House Price Index (HPI), which is the first time this year that prices have fallen.
The average UK home was worth £265,497 in April which was down 2.7 per cent on the previous month but up 3.5 per cent compared to the previous year.
Meanwhile the average London property was priced at £566,614 in April, following a rise of 2.6 per cent month-on-month, and a 3.3 per cent gain annually.
The overall monthly price fall for the UK followed changes to stamp duty that came into force in April and piled more costs onto buyers, particularly on pricier homes.
The data was analysed by online estate agents Purplebricks following the latest monthly HPI report from the Office of National Statistics (ONS) released today.
The report will be welcome reading for homeowners in some of London’s most expensive areas, which have seen months of continued price drops.
Homes in upmarket Kensington and Chelsea saw prices surge by 9 per cent in a month – a gain of £123,815 on average to a new typical value of £1.34million.
The City of London also saw a big rise of 7 per cent, adding £53,255 to the average property and taking the typical value up to £771,818.
Westminster homes enjoyed an encouraging month too with an increase of 3 per cent or £28,408, to give properties a new average price tag of £946,923 on.
But despite the monthly price rises, homes in all three of those London boroughs were worth less in April 2025 than the year before – with Westminster homes hardest hit, losing £144,879.
Throughout the capital, 16 boroughs saw a month of price rises while ten areas saw a month-on-month loss. Seven areas of London saw no change.
The biggest loser this month was located on the London-Essex border at Epping Forest, which saw a 4 per cent decrease amounting to £22,913 being knocked off property prices.
While London had a prosperous month overall, homes in Hackney lost 3 per cent in value, the equivalent of £18,883.
Despite it being a tough month for house prices in many parts of the UK, homes have seen an average value increase of £9,000 over the past year.
| Area | Percentage increase MOM | Money gained |
|---|---|---|
| 1. Kensington and Chelsea | 9% | £123,815 |
| 2. City of London | 7% | £53,255 |
| 3. City of Westminster | 3% | £28,408 |
| 4. Tandridge | 5% | £26,972 |
| 5. Islington | 3% | £18,904 |
| 6. Winchester | 4% | £18,601 |
| 7. Three Rivers | 3% | £18,287 |
| 8. Elmbridge | 2% | £15,168 |
| 9. Cambridge | 3% | £15,110 |
| 10. London | 3% | £14,732 |
| Area | Percentage decrease MOM | Money lost |
|---|---|---|
| 1. Epping Forest | -4% | -£22,913 |
| 2. Hackney | -3% | -£18,883 |
| 3. Chichester | -4% | -£18,621 |
| 4. Cotswold | -4% | -£17,121 |
| 5. North Hertfordshire | -4% | -£14,402 |
| 6. South Cambridgeshire | -3% | -£14,365 |
| 7. Brighton & Hove | -3% | -£13,238 |
| 8. North West | -6% | -£13,105 |
| 9. Newham | -3% | -£12,878 |
| 10. North East | -8% | -£12,637 |
| Area | Percentage increase YOY | Money gained |
|---|---|---|
| 1. Elmbridge | 7% | £56,121 |
| 2. Bromley | 10% | £52,067 |
| 3. Lewisham | 10% | £51,550 |
| 4. Cambridge | 10% | £51,060 |
| 5. Three Rivers | 9% | £50,141 |
| 6. Haringey | 8% | £49,637 |
| 7. Uttlesford | 9% | £46,583 |
| 8. Waltham Forest | 9% | £46,056 |
| 9. Kingston upon Thames | 7% | £41,578 |
| 10. Sevenoaks | 8% | £41,260 |
| Area | Percentage decrease YOY | Money lost |
|---|---|---|
| 1. Westminster | -15% | -£144,879 |
| 2. City of London | -14% | -£110,370 |
| 3. Hammersmith | -11% | -£82,731 |
| 4. Islington | -10% | -£65,487 |
| 5. Cotswold | -8% | -£32,155 |
| 6. Wandsworth | -4% | -£27,909 |
| 7. Camden | -3% | -£21,879 |
| 8. Newham | -5% | -£21,601 |
| 9. Hackney | -2% | -£14,162 |
| 10. Kensington and Ch | -1% | -£13,458 |
April marks the fourth consecutive month of annual price rises for UK properties. Since April 2024, homes have increased by 3.5 per cent over the last calendar year.
House prices in England saw an annual rise of 3 per cent, making the average property worth £286,000; while Wales had a 5.3 per cent increase and homes stood at £210,000 on average.
In Scotland there was a 5.8 per cent increase, putting a £191,000 on the average home.
The HPI report also revealed there were fewer UK homes put up for sale in February this year, with nearly 7,000 fewer sold in February 2025 compared to the same time last year.
Purplebricks sales director Tom Evans said: ‘This small monthly decline is little more than a bump in the road – a stumble after April’s stamp duty changes.
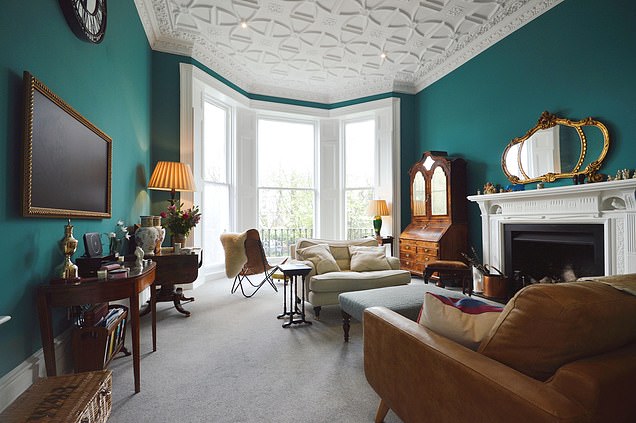
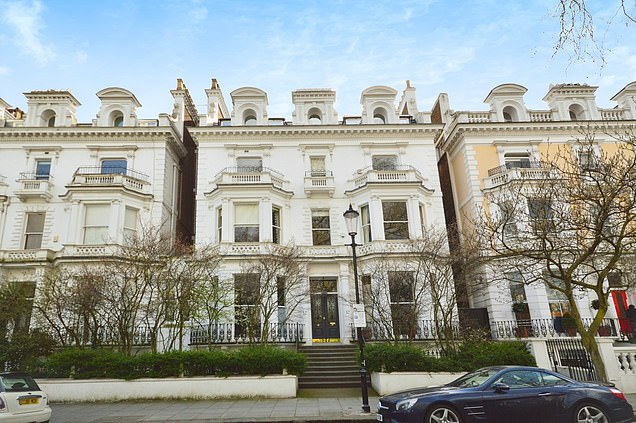
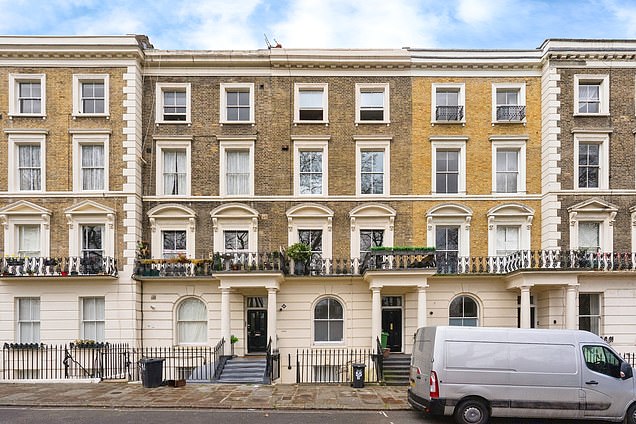
KENSINGTON AND CHELSEA: This impressive three-bedroom duplex on Pembridge Square in West London is on the market with Purplebricks for £4.5million – click here to view the listing
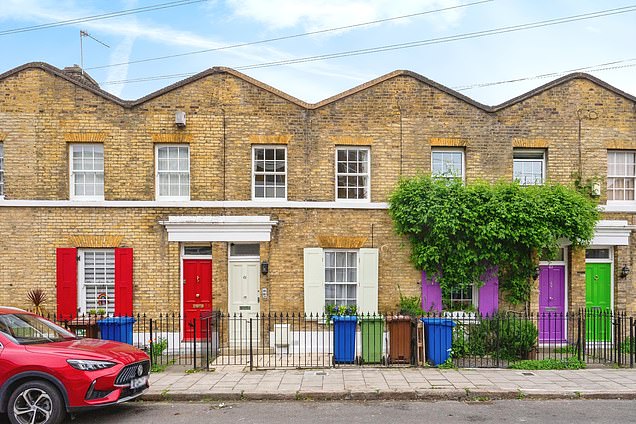
CITY OF LONDON: This three-bedroom terraced house on Pages Walk is on for £950,000 with Purplebricks – click here for the listing
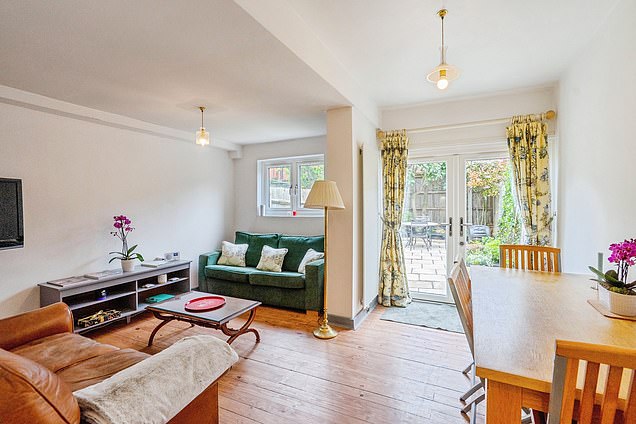
CITY OF WESTMINSTER: This two-bedroom maisonette on Oakley Square is on the market for £800,000 with Purplebricks – click here to view the listing
‘One of the best investments you can make is in bricks and mortar, and most buyers are looking at the long-term when they sign on the dotted line.
‘2025 has so far been a great year for the market with continued price rises, which I predict will be back before long.’
Robert Nichols, managing director of Purplebricks Mortgages, added: ‘With 0 per cent deposits, the lowest mortgage rates in two years, the UK is a buyers’ market right now.
‘And, rising wages means there are more first-time buyers encouraged to put that all-important first foot on the property ladder.
‘Movement at the bottom of the ladder will pay dividends in the long-run, promoting sales further and further up the chain – ultimately nudging prices up over time.’


