

For the third year running, London has been crowned the world’s worst megacity for traffic – with average speeds of just over 10mph.
Drivers across the UK capital face significant delays, as a new report released by TomTom shows a six-mile trip averages 35 minutes and seven seconds, cementing London’s status as having the slowest-moving traffic in the world.
The Annual TomTom Traffic Index evaluates the speed of movement of satellite navigation users in 501 cities across 62 countries on six continents.
To determine the world’s worst megacities – areas with a population of more than eight million – for traffic, it looks at factors such as average congestion levels, average speeds in traffic, average distance driven in 15 minutes and the time lost during rush hour.
With millions of vehicles continuing to travel across London every day, things look to be getting even worse for Londoners needing to move quickly.
The report further found that average travel times in the capital are now 45 seconds longer than last year, resulting in the typical driver losing a whopping 136 hours annually stuck in rush-hour traffic.
According to the index, the worst day for congestion was 10 September, 2025, when a widespread strike across the London Underground forced commuters to seek alternative transport. By 5pm, congestion surged by up to 135 per cent.
Andy Marchant, traffic expert at TomTom, said: ‘London’s place as the slowest capital city in the Traffic Index really highlights the strain on the city’s roads.
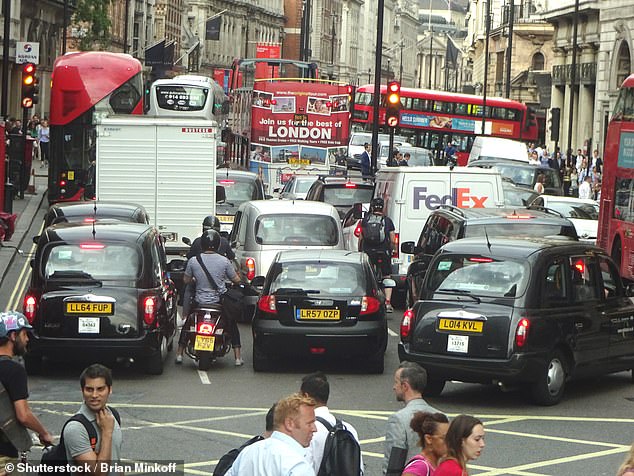
London (pictured) has been crowned the world’s worst capital city for traffic for the third year in a row, as revealed in a new report by TomTom
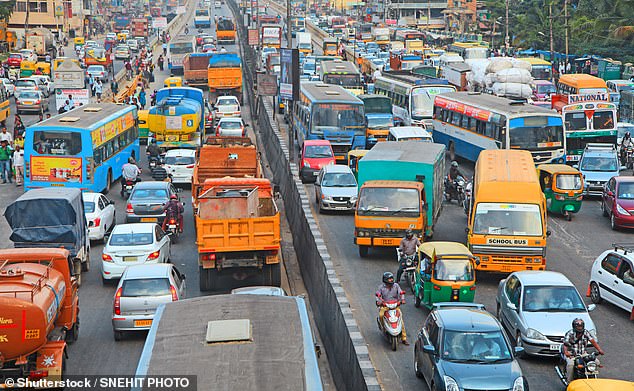
Looking at megacities overall, India’s Bangalore – the centre of India’s high-tech industry – follows closely behind London in second place
‘Many of these streets were built in the Middle Ages and expanded in the Georgian era, but they simply weren’t built for the volume and variety of traffic we see today.’
But is there a solution? Marchant noted: ‘Trials of autonomous vehicles will be rolled out across 20 London boroughs, giving local authorities and city planners a real opportunity to rethink how cities manage congestion and keep people moving.’
Looking at megacities overall, India’s Bangalore – the centre of India’s high-tech industry – follows closely behind London in second place.
The IT powerhouse, officially named Bengaluru but also commonly known as India’s ‘Silicone Valley’, experiences average congestion rates of 74 per cent, with drivers losing a staggering 168 hours a year stuck in traffic.
In third place is Mexico City, Mexico, where citizens travel as far as 4.4km in just 15 minutes, followed by India’s Hyderabad in fourth place, with average congestion rates exceeding 55 per cent.
Rounding the top five is Colombia’s capital, Bogota, where drivers lose 153 hours each year sitting in traffic, and the average speeds are almost 19km/ph.
Other megacities ranked in the top ten are New York City (United States), Buenos Aires (Argentina), Chennai (India), Paris (France), and Ahmedabad (India).
In the UK, multiple British cities also experience higher overall congestion levels, with Belfast leading the ranking.
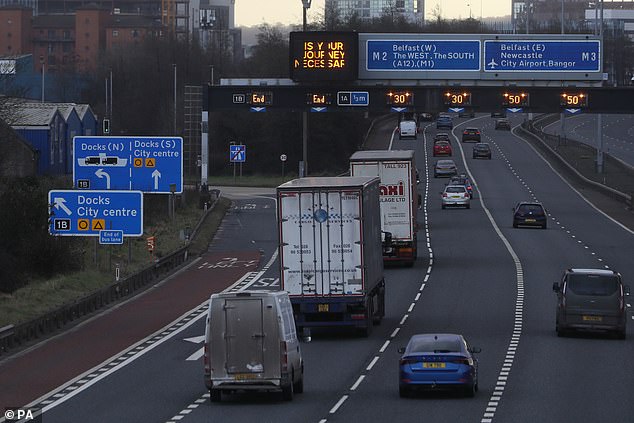
Ahead of Cambridge, Edinburgh, Exeter, Brighton and Hove, Norwich, and Kingston Upon Hull, Belfast (pictured) lead the ranking of being the UK’s most traffic-filled city
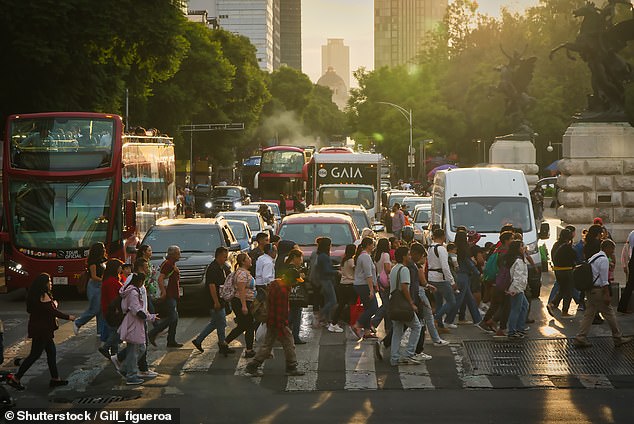
In terms of average congestion, Mexico City has the worst in the world, according to the index – with 75.9%
According to TomTom, Belfast is the UK’s most traffic-filled city, registering congestion levels over 58 per cent.
Also having high quantities of traffic than London were Cambridge, Edinburgh, Exeter, Brighton and Hove, Norwich, and Kingston Upon Hull.
In terms of average congestion, Mexico City has the worst in the world, according to the index – with 75.9%.
In second place is Bengalaru, with 74.4%, and Bogota came in third place, with 69.6%.