


There’s something really, really, REALLY weird going on with Trump’s poll numbers.
Not that there is anything exactly new about that, but I was gobsmacked when I saw Gallup’s latest numbers and recalled having seen other horrible polls for the president, so I decided to do a little digging.
Six months into his second term, President Donald Trump’s job approval rating has dipped to 37%.
This is the lowest rating of Trump’s second term and just slightly higher than his all-time worst rating of 34% at the end of his first term. pic.twitter.com/raeIPfpFZj
— Gallup (@Gallup) July 24, 2025
If Gallup’s numbers are right, Trump is being pulled by a political undertow that will be hard to swim against. When I read the poll, it wasn’t quite a gut punch, but it made me wonder whether I needed to give myself a reality check. No, I knew I needed a reality check, because it is stupid to be willfully blind to data.
And what did I find? Absolute chaos, and it is not entirely based on the political leanings of the pollsters, although there certainly appears to be a liberal bias to many of the polls.
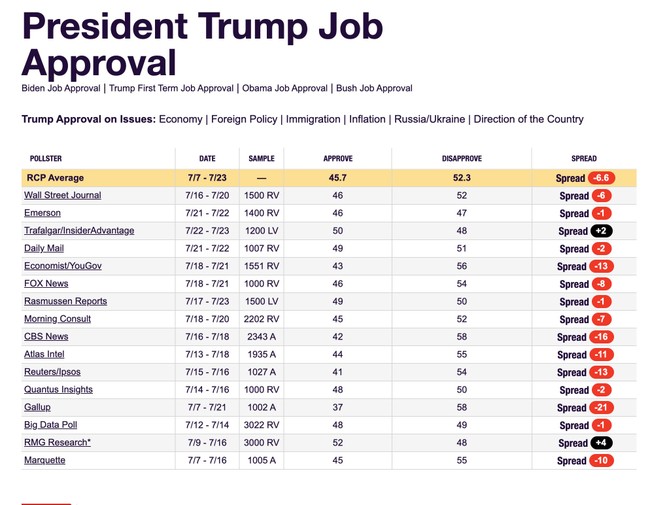 As you can see from the RealClearPolitics chart, the over/under for Trump’s approval is -6.6, which has the ring of truth about it. Trump has taken an absolute beating in the press, and he starts with a lower base than almost any other national politician. A lot of people who might give slack to somebody with a less “in your face” style wake up in the morning with gritted teeth knowing Trump is president.
And Trump works hard to keep them angry. He keeps his own base ginned up by infuriating liberals, and a lot of moderates absolutely hate his style.
To me, it’s no surprise that he is underwater, even after his string of victories that you and I are applauding.
Now look at Gallup. It has a -21% over/under. That, to me, seems implausible. So implausible, given the other polls’ numbers, that it looks as credible as an Ann Selzer poll predicting that Harris would win Iowa in a landslide.
If Gallup were the only outlier, though, you could assume that it was just a bad poll, even though it was conducted over a significant period of time. A bad sample for some reason.
Except…look again at the RCP chart, and a pattern emerges. Trump’s poll numbers aren’t spread out in anything like a Bell Curve around the average. It’s more like a bimodal curve, where there are two peaks instead of one. If the errors that are natural to polls–that’s why they have a +/- margin of error, assuming randomly distributed polling errors–were the variable then you would expect a one-peak bell curve.
And that’s not what we see.
Instead, you see some polls–like the Wall Street Journal, Emerson, Trafalgar, Fox, Rasmussen, and Quantus congregating around one average, and YouGov, CBS, Atlas Intel, Reuters, and Gallup around a much higher disapproval rating. That means the RCP average is not representative of the data, except in a minimal way. There really are TWO averages in that chart. The RCP average is effectively the average of two separate sets of data that obviously are apples and oranges, not different apples.
What’s going on here? You could assign the problem to partisan leans of the pollsters, but then how do you explain Atlas Intel–which has been remarkably accurate? While it is not Gallup-level bad for Trump, it is in the group least favorable to Trump. Conversely, some of the better polls for Trump are not from “conservative”-leaning pollsters.
Wild stuff.
Only 34% of men age 18-29 identify (lean) Democratic. For those keeping score that’s 24-point gap btw. young men and women. That’s as large as I’ve seen. https://t.co/sFaz8HuJ9n
— Daniel Cox (@dcoxpolls) July 24, 2025
Then there is the Pew data I just wrote about this morning, which shows Republicans and Democrats are pretty evenly tied in party preference–far more so than in 2017, when Democrats dominated. Democrats are losing core constituencies–bleeding support, actually–and have taken a far worse beating than Trump.
The US adult population has gone from D+6 in 2020 to R+1 today, according to fresh @pewresearch NPORS data. https://t.co/vV6jVVbC7P pic.twitter.com/LMLb2ibOXb
— Kristen Soltis Anderson (@KSoltisAnderson) July 23, 2025
There has been–according to Pew, which is hardly a Republican-leaning pollster–a 7-point swing against the Democrats and an actual revolt among men against the party. Are people who have moved from Democrat to Republican simultaneously hating on Trump?
It is true that support for a party is not the same as support for the president, and it is also true that the number of Independents is significant and not included in the party totals, but such a considerable divergence is…unexpected.
In other words, the data doesn’t all add up without making some improbable assumptions.
Normally, I would make some snarky comment based on my take on the issue, but I am not sure what to make of all this other than that there is a problem–and not a problem solved by averaging out the polls as RCP tries to. This is not a knock on RCP–it’s an observation that the averaging assumes a Bell Curve distribution of errors, and we have a bimodal curve here.
So I am perplexed.
-
Editor’s Note: The mainstream media continues to deflect, gaslight, spin, and lie about President Trump, his administration, and conservatives.
Help us continue to expose their left-wing bias by reading news you can trust. Join Hot Air VIP and use promo code FIGHT to get 60% off your membership.