
The popularity of Saxton’s maps reflected the desire for consistency and precision
With the British Library and the University of Chicago Press, Bodleian Library Publishing is one of the leading publishers on cartographic history. Indeed, alongside this book, they have also recently published Carlotta Forss’s excellent and very well-illustrated Mapping the North-Myth, Exploration, Encounter (2025, £25.00), a perfect Christmas present in its combination of text and illustrations with a particularly attractive section on “Animals on Northern Maps”.
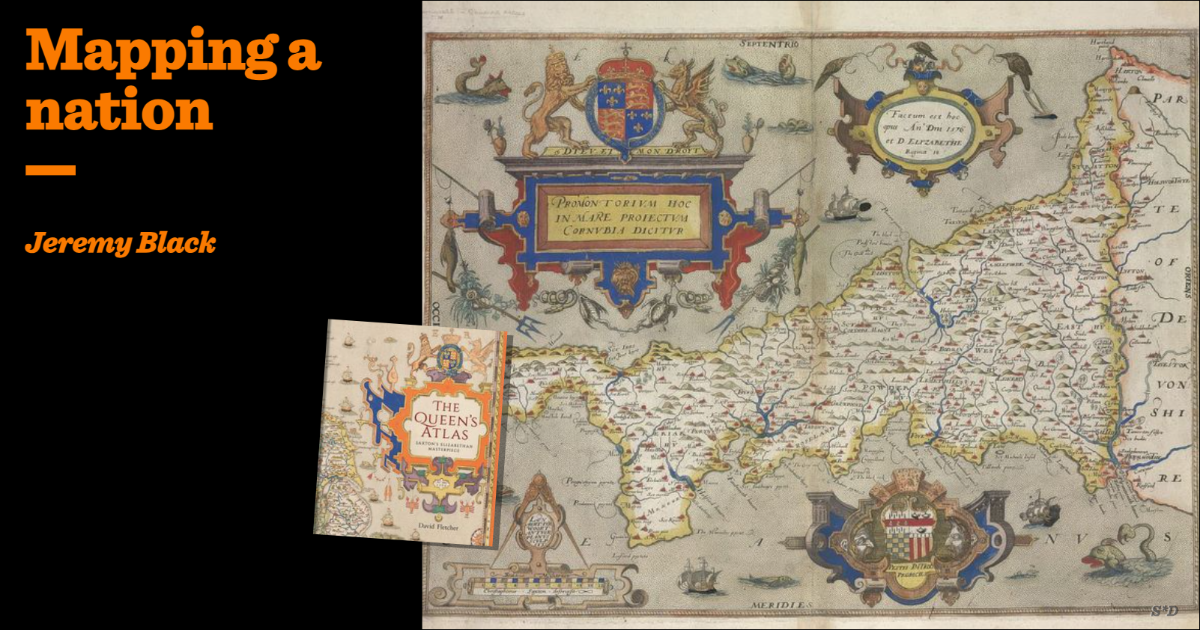
Fletcher is more centred, to Christopher Saxton and his mapmaking for Elizabeth I. Born in about 1542-4 in Yorkshire, the talented Saxon learned surveying and was commissioned to produce county maps by Thomas Seckford, a MP and prominent official, whose arms appear below the cartouche, and who was close to Elizabeth’s leading minister, Sir William Cecil, Lord Burghley (1520-98), Secretary of State from 1550 to 1553 and 1558 to 1572, and Treasurer from 1572 until his death. The industrious Burghley had a substantial collection of maps, some annotated in his own hand, and was a key patron of Laurence Nowell (1515-76) in his mapping and other scholarly work in the 1560s. Burghley’s manuscript maps included early proof states of Saxton’s printed county maps, bound together in an atlas.
Saxton’s maps of the counties was backed by the government, the Privy Council in 1576 instructing the Justices of the Peace and Mayors in Wales to give him all assistance in travelling and viewing the principality, while Burghely was sent proof copies of the county maps and added his own notes to the margins. Saxton carried out surveys that led to the engraving of 34 county maps, most of which covered a single country, although some covered several, a practice that was criticised. The scale of the maps varied as did the degree of pictorial detail. Woods, bridges and hills were drawn in, as were the fenced-off parks of major landowners, but not roads. The level of accuracy was high, although there were some significant errors, such as the shape of Cornwall, in that the Lizard Peninsula was overly large, a point that was clearer in the county map.
The popularity of Saxton and Saxton-derived maps reflected the desire for images drawn to scale in which crucial physical outlines were precisely marked. The maps also indicated the increased use of uniform conventional symbols to depict, for example forests and hills.
Although plans of county towns were added, his maps were copied with few, if any, changes for two centuries, largely because the cost and effort of new surveys appeared redundant not only for commercial reasons, but also due to the authority of the Saxton maps. His copper plates were reused, but with alterations, for example by William Webb in 1645 and Philip Lea in about 1690. Partly as a result, the maps helped to establish and consolidate the visual image of counties, and to provide pictorial support to the idea of England and Wales as an assembly of counties.
The significance of the county for local government, justice and the raising of troops, all encouraged this idea. So also did the extent to which the reorganisation of dioceses under Henry VIII in 1540-1 increased the overlap between them and counties: while Westminster did not retain its new status, Chester, Gloucester, Peterborough, Bristol and Oxford did.
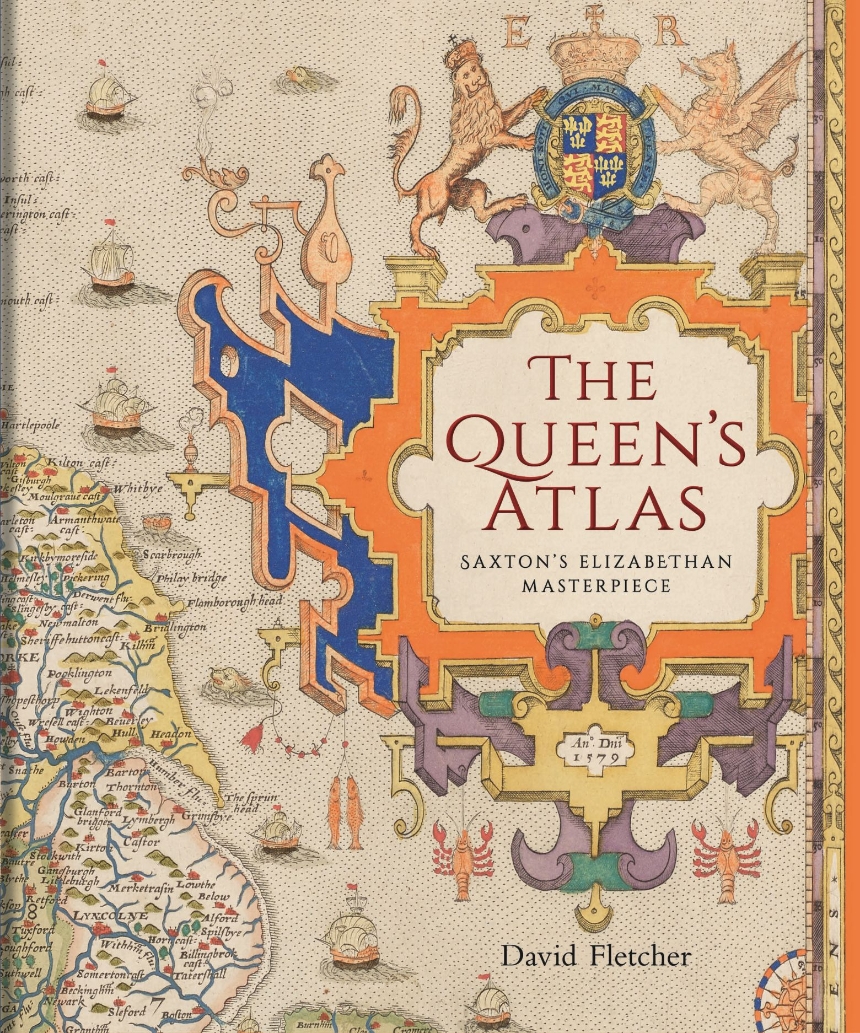
In a very handsomely and appropriately illustrated book, Fletcher provides valuable details about government support for the project and locates this support and project in terms of the map culture and its impact on Saxton’s methods, on patronage, on competition, on the engraving of maps, on the usage of Saxton’s maps and on his legacy. All of his county maps are reproduced. At once scholarly and very attractive.