

Newcastle has been revealed as the best place in the UK for a BBQ this summer.
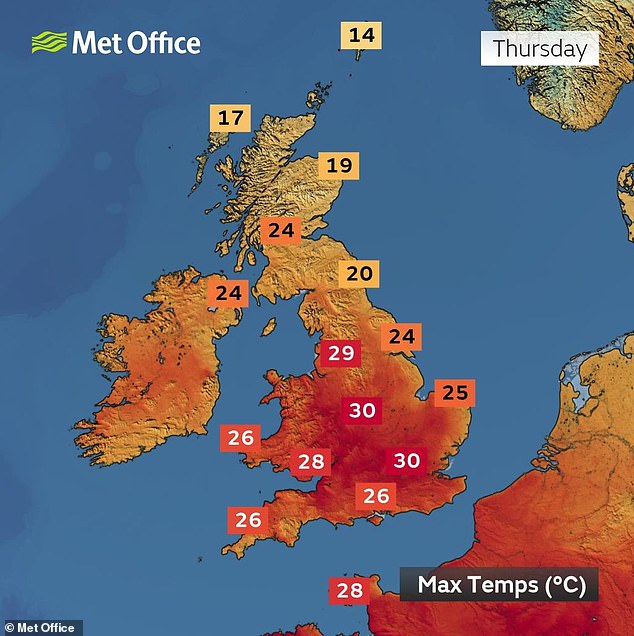
The latest findings come as Britain’s temperature is set to soar into the 30s this weekend, with an amber heat-health alert being issued earlier today.
London boroughs nabbed nearly half of the top 10 places to get a grill going, with Camden, Tower Hamlets, Wandsworth, Newham and Merton all making the cut, according to new data.
North and South Tyneside were also strong contenders while locations in the South East like Epsom and Ewell, Hastings and Runnymede were the other top choices for a cookout.
These ideal BBQ spots were decided after taking factors like green space access, temperatures, sunshine, rainfall and wind during the summer months into account.
Areas in the South East benefit from more sunshine and less rain on average – crucial for a good grill – while the other top spots scored well in their relation to access to public parks.
Tower Hamlets recorded the highest number of parks in a 1,000m radius, with 12 parks within walking distance of the centre.
Locals could also enjoy the shortest journey to a green space at just 209 metres, though individual parks tended to be on the smaller side.
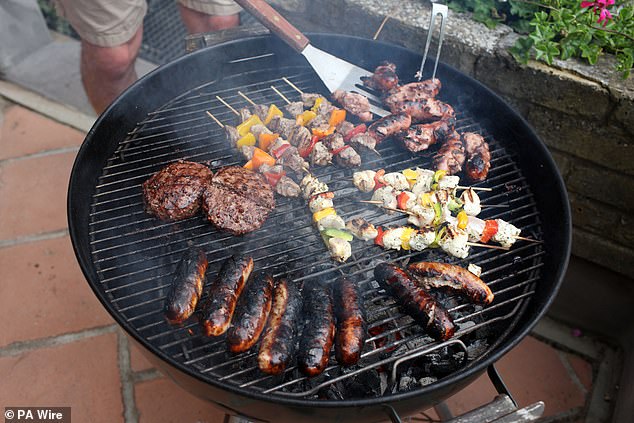
Newcastle has been revealed as the best place in the UK for a BBQ this summer, while several London boroughs have all nabbed some of the top spots
| Location | Score | Distance to nearest park/public garden (m) | Size of nearest park/public garden (m2) | Number of parks/public gardens in 1,000 m radius | Daily Maximum Temperature (°C) | Maximum Temperature (°C) | Daily Precipitation (mm) | Daily Sunshine Duration (hr) | Daily Maximum Wind Speed (mph) | |
|---|---|---|---|---|---|---|---|---|---|---|
| Newcastle upon Tyne | 59.68 | 351 | 116,428 | 6 | 27.1 | 30.1 | 4.0 | 10.1 | 17.7 | |
| Camden | 59.66 | 337 | 385,723 | 8 | 26.7 | 29.1 | 2.2 | 10.5 | 19.5 | |
| North Tyneside | 59.57 | 474 | 151,243 | 3 | 27.1 | 30.1 | 4.0 | 10.1 | 17.7 | |
| Epsom and Ewell | 59.34 | 502 | 464,206 | 3 | 26.6 | 29.1 | 2.0 | 10.6 | 19.6 | |
| Hastings | 59.27 | 406 | 145,009 | 5 | 26.6 | 28.8 | 1.6 | 10.6 | 20.2 | |
| South Tyneside | 59.11 | 400 | 125,441 | 5 | 27.2 | 30.1 | 4.1 | 10.1 | 17.7 | |
| Wandsworth | 59.07 | 375 | 607,481 | 3 | 26.6 | 29.1 | 2.1 | 10.5 | 19.6 | |
| Runnymede | 58.95 | 553 | 3,066,460 | 2 | 26.6 | 29.1 | 2.1 | 10.5 | 19.5 | |
| Tower Hamlets | 58.94 | 209 | 58,023 | 12 | 26.7 | 29.1 | 2.0 | 10.5 | 19.5 | |
| Newham | 58.80 | 352 | 158,611 | 4 | 26.7 | 29.1 | 2.0 | 10.6 | 19.5 |
‘Newcastle’s position at the top of our rankings might raise a few eyebrows, but the data clearly shows it offers an excellent combination of accessible green spaces and favourable weather,’ explained Marc Porcar, CEO of QR Code Generator, who commissioned the study.
‘What’s particularly interesting is how the North East region performs strongly, with three locations in the top 10.
‘This challenges the common perception that the south of England always offers the best outdoor summer experience.
‘With average maximum temperatures above 27C during summer, these areas actually record higher peak temperatures than many southern locations, while still maintaining moderate wind speeds around 17.7mph.’
On the other end of the grilling spectrum, places you might want to avoid setting up for a ‘brai’ include locations in Scotland, Wales and the South West.
The Isles of Scilly, Pembrokeshire, Ceredigion and Cornwall all scored poorly – which may come as a surprise – mostly due to the strong winds that could make an outdoor meal take a bit of a battering.
And while many of them are arguably more scenic then a sprawling metropolis, they were all far from a park or public garden.
‘Wind speed emerges as a critical factor for BBQ success,’ Mr Porcar said.
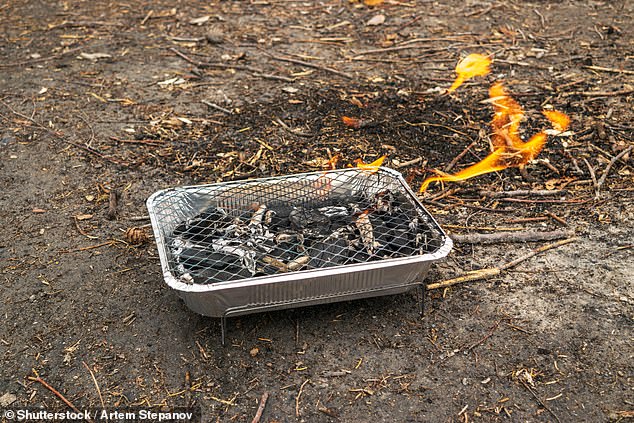
We should also be paying more attention to the type of charcoal we use, as cheap coals and disposable BBQs won’t last as long and can leave a chemical taste in your food
| Location | Score | Distance to nearest park/public garden (m) | Size of nearest park/public garden (m2) | Number of parks/public gardens in 1,000 m radius | Daily Maximum Temperature (°C) | Maximum Temperature (°C) | Daily Precipitation (mm) | Daily Sunshine Duration (hr) | Daily Maximum Wind Speed (mph) | |
|---|---|---|---|---|---|---|---|---|---|---|
| Na h-Eileanan Siar | 18.06 | 4,998 | 17,446 | 1 | 26.7 | 28.6 | 4.6 | 9.8 | 20.9 | |
| Isles of Scilly | 24.07 | 763 | 9,941 | 2 | 26.0 | 27.1 | 2.5 | 10.4 | 23.3 | |
| Pembrokeshire | 28.17 | 2,266 | 52,647 | 1 | 26.3 | 28.3 | 2.4 | 10.5 | 20.9 | |
| Ceredigion | 28.84 | 3,908 | 7,740 | 1 | 26.5 | 28.8 | 2.4 | 10.5 | 20.0 | |
| Cornwall | 29.83 | 2,226 | 108,523 | 1 | 26.2 | 28.1 | 2.4 | 10.5 | 21.2 | |
| Argyll and Bute | 31.96 | 4,443 | 139,780 | 1 | 26.6 | 29.0 | 3.5 | 10.1 | 19.9 | |
| Carmarthenshire | 34.16 | 2,825 | 220,525 | 1 | 26.4 | 28.6 | 2.6 | 10.5 | 20.3 | |
| South Hams | 34.18 | 2,454 | 20,483 | 1 | 26.2 | 28.4 | 1.9 | 10.5 | 20.5 | |
| Isle of Anglesey | 35.70 | 3,585 | 264,586 | 1 | 26.6 | 28.9 | 2.9 | 10.4 | 20.0 | |
| Torridge | 35.74 | 3,344 | 413,781 | 1 | 26.3 | 28.4 | 2.1 | 10.5 | 20.6 |
‘Even with warm temperatures, locations with consistently high winds scored poorly overall, as this can significantly impact both the BBQ cooking process, general comfort and the increased risk of uncontrolled fires.’
The perfect BBQ spot required ‘a balance of factors’, he added.
‘While weather is obviously important, having accessible green spaces nearby is equally necessary.’
The study analysed 371 local authorities across the UK, ranking each based on eight key factors which was then scaled and weighted equally to produce a final score out of 100.
This latest data comes after the UK has seen the mercury steadily rising into the late twenties – perfect for getting a grill going.
Today, thermometers reached 30.1C (86.2F) by 1pm at St James’s Park in London – making it the first day in 2025 to reach 30C and the hottest day of the year so far – and looked set to rise further to 32C (90F) this afternoon.
There are expected similar highs tomorrow and 34C (93F) predicted for Saturday.
Earlier, the Government’s UK Health Security Agency (UKHSA) activated a five-day alert from midday today until Monday morning amid concerns that the heat could cause ‘a rise in deaths, particularly among those ages 65 and over or with health conditions’.
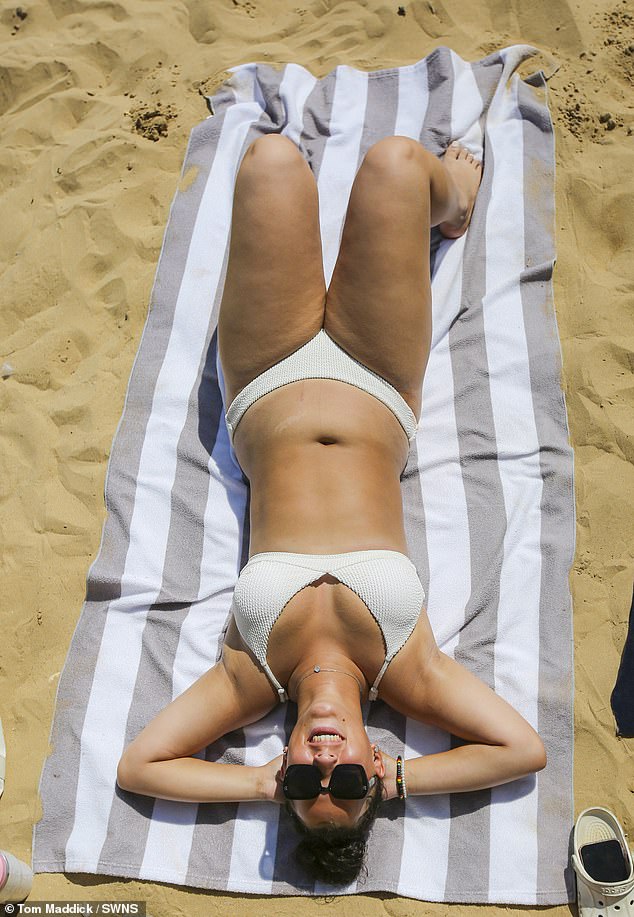
A woman soaks up the sun in the East Yorkshire seaside resort of Bridlington this morning

Two women walk in the sunshine at St James’s Park in London today as the heat continues
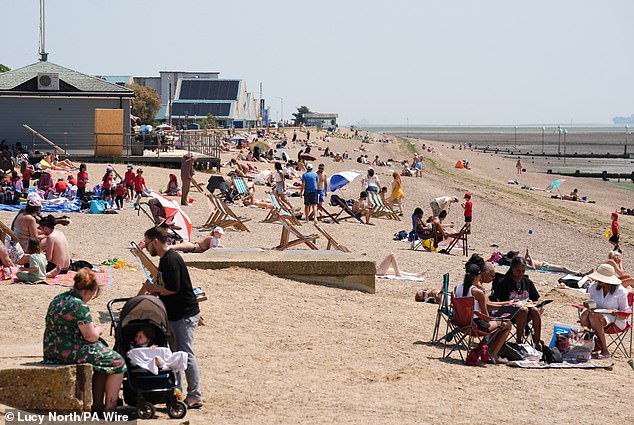
People enjoy the warm weather this afternoon on Jubilee Beach in Southend-on-Sea, Essex
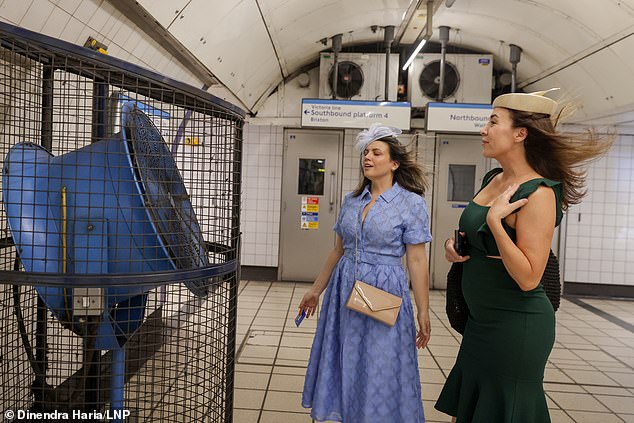
Two women travelling to Ladies Day at Royal Ascot cool off on the London Underground today
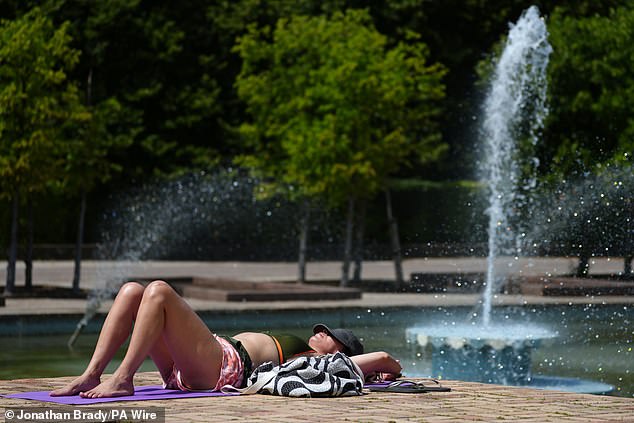
A woman sunbathes near the fountains at Battersea Park in South West London today
The warning said ‘significant impacts are likely across health and social care services due to the high temperatures’ along with ‘increased demand for power exceeding capacity’ and ‘heat affecting the ability of the workforce to deliver services’.
The UKHSA has previously placed most of England apart from the North under a lesser yellow heat-health until Sunday evening, but this has now been upgraded.
It is the first amber heat-health alert to be issued for two years since September 2023.
The heatwave is likely to officially end after Saturday, but the weather from Sunday into the middle of next week will stay warm with a range of 24C (75F) to 26C (79F).
| Local Authority | Average distance to nearest park or public garden (m) | Average size of nearest park or public garden (m2) | Average number of parks and public gardens in 1,000 m radius | Average Daily Maximum Temperature (°C) | Average Daily Maximum Apparent Temperature (°C) | Average Daily Total Precipitation (mm) | Average Daily Sunshine Duration (hr) | Average Daily Maximum Wind Speed (mph) | Score | Rank |
|---|---|---|---|---|---|---|---|---|---|---|
| Newcastle upon Tyne | 351.05 | 116,427.67 | 5.7 | 27.12 | 30.11 | 3.97 | 10.12 | 17.74 | 59.68 | 1 |
| Camden | 336.78 | 385,722.79 | 7.58 | 26.66 | 29.12 | 2.19 | 10.54 | 19.55 | 59.66 | 2 |
| North Tyneside | 473.84 | 151,242.92 | 3.25 | 27.15 | 30.14 | 3.97 | 10.15 | 17.72 | 59.57 | 3 |
| Epsom and Ewell | 502.47 | 464,205.60 | 2.8 | 26.62 | 29.07 | 1.97 | 10.55 | 19.57 | 59.34 | 4 |
| Hastings | 406.33 | 145,008.90 | 5.24 | 26.57 | 28.81 | 1.61 | 10.61 | 20.21 | 59.27 | 5 |
| South Tyneside | 399.98 | 125,441.10 | 4.59 | 27.15 | 30.14 | 4.05 | 10.11 | 17.74 | 59.11 | 6 |
| Wandsworth | 375.33 | 607,481.00 | 3.48 | 26.64 | 29.11 | 2.07 | 10.54 | 19.59 | 59.07 | 7 |
| Runnymede | 553.16 | 3,066,460.48 | 1.82 | 26.6 | 29.09 | 2.09 | 10.55 | 19.46 | 58.95 | 8 |
| Tower Hamlets | 209.42 | 58,022.98 | 11.72 | 26.67 | 29.12 | 2.02 | 10.54 | 19.54 | 58.94 | 9 |
| Newham | 351.92 | 158,610.92 | 3.6 | 26.67 | 29.12 | 2.02 | 10.55 | 19.54 | 58.8 | 10 |
| Merton | 390.69 | 277,763.46 | 3.6 | 26.63 | 29.08 | 1.97 | 10.54 | 19.59 | 58.59 | 11 |
| Windsor and Maidenhead | 669.06 | 1,841,523.24 | 2.55 | 26.6 | 29.1 | 2.07 | 10.54 | 19.4 | 58.53 | 12 |
| Richmond upon Thames | 394.61 | 680,458.59 | 3.36 | 26.63 | 29.13 | 2.13 | 10.52 | 19.46 | 58.39 | 13 |
| Redbridge | 422.54 | 423,295.27 | 2.54 | 26.68 | 29.15 | 2.03 | 10.51 | 19.53 | 58.35 | 14 |
| Barking and Dagenham | 326.58 | 244,275.63 | 3.24 | 26.69 | 29.14 | 2 | 10.52 | 19.61 | 58.29 | 15 |
| Westminster | 341.37 | 235,922.53 | 6.06 | 26.66 | 29.12 | 2.19 | 10.54 | 19.55 | 58.08 | 16 |
| Broxbourne | 518.88 | 1,011,811.32 | 2.53 | 26.7 | 29.2 | 2.07 | 10.48 | 19.48 | 58.04 | 17 |
| Gateshead | 458.05 | 105,805.25 | 4.92 | 27.12 | 30.09 | 4 | 10.15 | 17.8 | 57.96 | 18 |
| Hackney | 262.08 | 115,476.08 | 6.79 | 26.67 | 29.15 | 2.05 | 10.52 | 19.51 | 57.92 | 19 |
| Gosport | 607.47 | 476,157.46 | 2.02 | 26.45 | 28.91 | 1.89 | 10.59 | 19.58 | 57.9 | 20 |
| Nottingham | 469.01 | 219,396.50 | 3.22 | 26.83 | 29.54 | 2.57 | 10.37 | 18.73 | 57.69 | 21 |
| Lewisham | 309.62 | 93,177.51 | 4.81 | 26.66 | 29.09 | 1.94 | 10.54 | 19.61 | 57.45 | 22 |
| Stoke-on-Trent | 281.43 | 181,584.00 | 5.6 | 26.72 | 29.41 | 2.56 | 10.35 | 18.8 | 57.36 | 23 |
| Hounslow | 429.47 | 203,681.72 | 2.83 | 26.63 | 29.12 | 2.05 | 10.55 | 19.46 | 57.33 | 24 |
| Chelmsford | 909.1 | 260,884.52 | 1.78 | 26.73 | 29.13 | 1.86 | 10.55 | 19.75 | 57.28 | 25 |
| Cannock Chase | 662.31 | 1,858,211.51 | 1.48 | 26.68 | 29.33 | 2.4 | 10.47 | 18.86 | 57 | 26 |
| Havering | 493.18 | 218,342.78 | 2.54 | 26.69 | 29.1 | 2.04 | 10.57 | 19.72 | 57 | 27 |
| Birmingham | 521.34 | 601,440.94 | 2.42 | 26.66 | 29.31 | 2.47 | 10.49 | 18.93 | 56.93 | 28 |
| Harlow | 257.76 | 109,186.81 | 5.4 | 26.72 | 29.21 | 2.07 | 10.49 | 19.5 | 56.9 | 29 |
| Walsall | 718.15 | 613,660.25 | 1.85 | 26.67 | 29.31 | 2.39 | 10.51 | 18.88 | 56.89 | 30 |
| Peterborough | 905.81 | 511,975.56 | 1.99 | 26.87 | 29.49 | 2.49 | 10.43 | 18.98 | 56.81 | 31 |
| Barnet | 390.9 | 139,178.68 | 3.43 | 26.67 | 29.19 | 2.18 | 10.54 | 19.39 | 56.61 | 32 |
| Leicester | 424.59 | 144,451.71 | 3.49 | 26.78 | 29.48 | 2.49 | 10.41 | 18.83 | 56.58 | 33 |
| Rushmoor | 454.08 | 94,689.88 | 3 | 26.58 | 29.05 | 1.97 | 10.58 | 19.43 | 56.54 | 34 |
| Lambeth | 323.1 | 177,291.28 | 5.61 | 26.66 | 29.11 | 2.06 | 10.51 | 19.59 | 56.54 | 35 |
| Waltham Forest | 427.88 | 123,622.59 | 4.33 | 26.67 | 29.15 | 2.05 | 10.52 | 19.51 | 56.23 | 36 |
| Bury | 599.15 | 404,041.10 | 2.42 | 26.8 | 29.54 | 3.05 | 10.31 | 18.6 | 56.19 | 37 |
| Stockport | 514.42 | 311,483.06 | 2.44 | 26.78 | 29.52 | 3 | 10.34 | 18.66 | 56.13 | 38 |
| Basildon | 699.68 | 226,875.02 | 1.56 | 26.7 | 29.06 | 1.94 | 10.58 | 19.78 | 56.12 | 39 |
| Hart | 572.98 | 263,597.08 | 2.27 | 26.56 | 29.04 | 2.03 | 10.57 | 19.49 | 56.1 | 40 |
| Stockton-on-Tees | 803.76 | 281,660.44 | 1.49 | 27.08 | 30.01 | 3.65 | 10.23 | 18 | 56.1 | 41 |
| Erewash | 832.36 | 445,028.99 | 1.59 | 26.81 | 29.51 | 2.51 | 10.41 | 18.76 | 56.09 | 42 |
| Sheffield | 571.69 | 185,402.87 | 2.7 | 26.86 | 29.62 | 2.87 | 10.31 | 18.59 | 56.08 | 43 |
| Southwark | 235.36 | 99,620.36 | 10.22 | 26.66 | 29.11 | 2.06 | 10.51 | 19.59 | 56.07 | 44 |
| Sutton | 429.84 | 140,316.46 | 3.14 | 26.63 | 29.08 | 1.97 | 10.54 | 19.59 | 56.04 | 45 |
| Aberdeen City | 720.12 | 266,205.72 | 2 | 27.42 | 30.55 | 4.77 | 9.82 | 17.08 | 56.03 | 46 |
| Thanet | 513 | 38,113.73 | 3.39 | 26.62 | 28.78 | 1.53 | 10.64 | 20.62 | 56.03 | 47 |
| Brentwood | 1,017.66 | 354,887.94 | 2.01 | 26.7 | 29.1 | 2 | 10.55 | 19.7 | 55.91 | 48 |
| Kensington and Chelsea | 355.67 | 134,090.27 | 4.69 | 26.66 | 29.12 | 2.19 | 10.54 | 19.55 | 55.89 | 49 |
| Greenwich | 386.7 | 159,100.59 | 3.73 | 26.66 | 29.08 | 2.04 | 10.53 | 19.59 | 55.83 | 50 |
| Gedling | 1,054.36 | 522,532.47 | 1.41 | 26.86 | 29.59 | 2.66 | 10.35 | 18.64 | 55.83 | 51 |
| Kingston upon Thames | 737.57 | 1,700,803.55 | 1.6 | 26.62 | 29.1 | 2.03 | 10.51 | 19.53 | 55.79 | 52 |
| Eastbourne | 569.16 | 134,868.48 | 2.35 | 26.55 | 28.81 | 1.74 | 10.61 | 20.02 | 55.67 | 53 |
| Bracknell Forest | 544.35 | 317,927.22 | 2.92 | 26.58 | 29.09 | 2.11 | 10.53 | 19.4 | 55.62 | 54 |
| Lichfield | 1,116.07 | 469,134.34 | 1.52 | 26.71 | 29.37 | 2.32 | 10.49 | 18.82 | 55.61 | 55 |
| Amber Valley | 839.76 | 348,736.17 | 1.91 | 26.82 | 29.52 | 2.57 | 10.37 | 18.75 | 55.57 | 56 |
| Spelthorne | 657.41 | 234,556.73 | 1.63 | 26.61 | 29.11 | 2.04 | 10.56 | 19.44 | 55.44 | 57 |
| Lincoln | 584.28 | 148,969.71 | 2.2 | 26.95 | 29.71 | 3.07 | 10.31 | 18.65 | 55.23 | 58 |
| Medway | 648.38 | 165,449.60 | 2.59 | 26.68 | 28.97 | 1.89 | 10.57 | 20 | 55.23 | 59 |
| Rutland | 2,525.71 | 4,048,109.46 | 1.18 | 26.85 | 29.52 | 2.62 | 10.43 | 18.84 | 55.23 | 60 |
| Brent | 442.43 | 168,829.01 | 2.68 | 26.66 | 29.16 | 2.15 | 10.52 | 19.45 | 55.21 | 61 |
| Thurrock | 784.05 | 371,023.34 | 2 | 26.69 | 29.09 | 2.02 | 10.54 | 19.74 | 55.18 | 62 |
| Enfield | 440.09 | 150,895.65 | 3.56 | 26.67 | 29.17 | 2.11 | 10.5 | 19.48 | 55.03 | 63 |
| Milton Keynes | 624.64 | 357,232.26 | 2.22 | 26.7 | 29.32 | 2.43 | 10.47 | 19.19 | 54.96 | 64 |
| Castle Point | 1,048.75 | 1,041,695.06 | 1.25 | 26.68 | 29.02 | 1.92 | 10.55 | 19.89 | 54.96 | 65 |
| Ashfield | 796.77 | 280,423.58 | 1.46 | 26.85 | 29.59 | 2.63 | 10.33 | 18.61 | 54.89 | 66 |
| Newcastle-under-Lyme | 756.61 | 242,338.49 | 4.02 | 26.7 | 29.38 | 2.45 | 10.34 | 18.8 | 54.88 | 67 |
| Bromley | 492.87 | 122,850.48 | 2.95 | 26.64 | 29.03 | 2.02 | 10.56 | 19.67 | 54.84 | 68 |
| Norwich | 628.63 | 107,082.19 | 2.58 | 26.86 | 29.21 | 2.01 | 10.53 | 19.87 | 54.82 | 69 |
| Southampton | 514.45 | 282,257.54 | 2.66 | 26.44 | 28.92 | 2.06 | 10.56 | 19.5 | 54.81 | 70 |
| Bedford | 867.63 | 219,134.66 | 2.27 | 26.75 | 29.35 | 2.41 | 10.51 | 19.11 | 54.78 | 71 |
| Bexley | 579.46 | 169,735.52 | 2.6 | 26.67 | 29.07 | 2.04 | 10.55 | 19.71 | 54.75 | 72 |
| Leeds | 783.4 | 177,129.84 | 2.04 | 26.94 | 29.75 | 3.21 | 10.25 | 18.37 | 54.7 | 73 |
| Croydon | 475.25 | 225,713.22 | 2.76 | 26.64 | 29.07 | 1.99 | 10.51 | 19.64 | 54.7 | 74 |
| Barnsley | 837.05 | 178,009.60 | 2.12 | 26.89 | 29.67 | 3.14 | 10.29 | 18.46 | 54.65 | 75 |
| Epping Forest | 1,074.83 | 477,199.11 | 1.6 | 26.72 | 29.19 | 2.08 | 10.51 | 19.54 | 54.64 | 76 |
| Middlesbrough | 746.75 | 116,448.98 | 2.05 | 27.1 | 30.06 | 3.73 | 10.18 | 17.98 | 54.63 | 77 |
| Manchester | 431.67 | 130,260.34 | 2.87 | 26.78 | 29.5 | 2.95 | 10.36 | 18.69 | 54.6 | 78 |
| Oxford | 528.78 | 304,911.12 | 2.35 | 26.61 | 29.18 | 2.13 | 10.47 | 19.2 | 54.58 | 79 |
| Dartford | 588.19 | 316,832.68 | 2.2 | 26.67 | 29.05 | 2.04 | 10.54 | 19.78 | 54.55 | 80 |
| Haringey | 318.27 | 81,492.33 | 6.25 | 26.66 | 29.13 | 2.12 | 10.5 | 19.54 | 54.45 | 81 |
| Sunderland | 650.36 | 125,899.16 | 1.83 | 27.12 | 30.08 | 4 | 10.14 | 17.86 | 54.45 | 82 |
| Hinckley and Bosworth | 1,186.24 | 391,867.69 | 1.52 | 26.74 | 29.39 | 2.31 | 10.46 | 18.89 | 54.45 | 83 |
| Ipswich | 601.22 | 140,564.14 | 2.13 | 26.74 | 29.02 | 1.92 | 10.56 | 20.08 | 54.43 | 84 |
| Warwick | 790.77 | 236,546.26 | 2.32 | 26.66 | 29.26 | 2.53 | 10.53 | 19.04 | 54.43 | 85 |
| Wokingham | 667.3 | 197,843.40 | 2.56 | 26.58 | 29.09 | 2.03 | 10.53 | 19.39 | 54.43 | 86 |
| City of Edinburgh | 513.86 | 257,438.54 | 4.05 | 27.06 | 29.84 | 4.5 | 9.95 | 18.2 | 54.29 | 87 |
| Watford | 385.72 | 160,396.03 | 3.16 | 26.65 | 29.17 | 2.27 | 10.49 | 19.37 | 54.25 | 88 |
| Wakefield | 744.7 | 141,329.33 | 1.84 | 26.93 | 29.73 | 3.12 | 10.28 | 18.44 | 54.22 | 89 |
| Rotherham | 886.58 | 199,179.78 | 1.59 | 26.9 | 29.66 | 2.91 | 10.3 | 18.51 | 54.16 | 90 |
| Dacorum | 630.21 | 99,719.11 | 3.73 | 26.69 | 29.25 | 2.28 | 10.52 | 19.27 | 54.16 | 91 |
| Great Yarmouth | 1,073.85 | 109,077.85 | 1.56 | 26.84 | 29.12 | 1.78 | 10.55 | 20.11 | 54.12 | 92 |
| Dundee City | 503.69 | 130,891.28 | 2.71 | 27.22 | 30.11 | 4.68 | 9.95 | 17.83 | 54.1 | 93 |
| Liverpool | 361.44 | 151,100.43 | 4.66 | 26.71 | 29.34 | 2.74 | 10.35 | 18.89 | 54.09 | 94 |
| Sandwell | 461.94 | 169,498.69 | 2.04 | 26.66 | 29.29 | 2.46 | 10.5 | 18.92 | 54.09 | 95 |
| Maidstone | 1,244.37 | 458,886.96 | 1.9 | 26.63 | 28.91 | 1.89 | 10.56 | 20.05 | 54.08 | 96 |
| Cambridge | 719.87 | 172,297.16 | 3.65 | 26.79 | 29.32 | 2.3 | 10.4 | 19.33 | 54 | 97 |
| Chesterfield | 856.42 | 164,246.58 | 1.53 | 26.86 | 29.62 | 2.81 | 10.36 | 18.57 | 53.98 | 98 |
| Tameside | 576.35 | 218,531.37 | 1.95 | 26.81 | 29.54 | 3.11 | 10.32 | 18.62 | 53.95 | 99 |
| Charnwood | 811.85 | 271,694.57 | 1.45 | 26.8 | 29.5 | 2.53 | 10.38 | 18.79 | 53.95 | 100 |
| East Lothian | 1,129.84 | 362,806.40 | 1.28 | 27.15 | 30.07 | 4.27 | 10.02 | 17.77 | 53.86 | 101 |
| Ealing | 374.97 | 90,079.44 | 4.13 | 26.65 | 29.16 | 2.08 | 10.48 | 19.43 | 53.86 | 102 |
| Wealden | 2,404.44 | 286,924.80 | 1.3 | 26.59 | 28.9 | 1.82 | 10.61 | 19.95 | 53.8 | 103 |
| Hammersmith and Fulham | 312.69 | 48,374.74 | 4.59 | 26.64 | 29.12 | 2.17 | 10.54 | 19.5 | 53.66 | 104 |
| Rother | 2,049.77 | 199,796.02 | 2.07 | 26.58 | 28.82 | 1.69 | 10.61 | 20.18 | 53.61 | 105 |
| Brighton and Hove | 621.39 | 119,391.03 | 2.79 | 26.54 | 28.89 | 1.89 | 10.59 | 19.82 | 53.61 | 106 |
| St. Helens | 478.56 | 183,304.75 | 2.55 | 26.73 | 29.38 | 2.7 | 10.33 | 18.77 | 53.57 | 107 |
| Northumberland | 1,650.24 | 157,656.87 | 1.47 | 27.1 | 30.08 | 3.75 | 10.1 | 17.73 | 53.56 | 108 |
| Waverley | 1,009.50 | 232,078.07 | 1.85 | 26.55 | 28.98 | 1.99 | 10.57 | 19.6 | 53.55 | 109 |
| Luton | 622.14 | 155,294.71 | 2.27 | 26.7 | 29.26 | 2.36 | 10.51 | 19.25 | 53.49 | 110 |
| Derby | 599.59 | 140,663.03 | 1.67 | 26.79 | 29.49 | 2.51 | 10.39 | 18.79 | 53.47 | 111 |
| Surrey Heath | 840.37 | 153,133.47 | 1.4 | 26.58 | 29.04 | 1.98 | 10.57 | 19.48 | 53.45 | 112 |
| Stevenage | 606.76 | 239,063.66 | 1.91 | 26.72 | 29.27 | 2.26 | 10.45 | 19.37 | 53.43 | 113 |
| Kingston upon Hull, City of | 887.93 | 163,011.44 | 1.38 | 27.1 | 29.9 | 3.61 | 10.27 | 18.47 | 53.38 | 114 |
| St Albans | 469.31 | 101,578.86 | 3.94 | 26.69 | 29.22 | 2.24 | 10.47 | 19.31 | 53.34 | 115 |
| Islington | 247.56 | 37,067.84 | 10.43 | 26.66 | 29.13 | 2.12 | 10.5 | 19.54 | 53.33 | 116 |
| Crawley | 831.36 | 387,670.87 | 1.23 | 26.59 | 28.98 | 2.04 | 10.6 | 19.75 | 53.33 | 117 |
| West Suffolk | 1,895.40 | 193,309.25 | 1.42 | 26.82 | 29.25 | 2.08 | 10.55 | 19.56 | 53.3 | 118 |
| Stafford | 1,621.03 | 1,562,188.13 | 1.34 | 26.69 | 29.36 | 2.45 | 10.38 | 18.85 | 53.28 | 119 |
| Cheshire West and Chester | 981.09 | 240,234.92 | 2.71 | 26.68 | 29.33 | 2.45 | 10.4 | 18.87 | 53.25 | 120 |
| Knowsley | 333.45 | 109,673.44 | 4.27 | 26.72 | 29.37 | 2.7 | 10.3 | 18.86 | 53.25 | 121 |
| Hertsmere | 537.03 | 98,404.39 | 2.62 | 26.68 | 29.21 | 2.25 | 10.52 | 19.36 | 53.24 | 122 |
| Rushcliffe | 2,007.57 | 336,944.15 | 1.34 | 26.85 | 29.59 | 2.66 | 10.36 | 18.67 | 53.21 | 123 |
| North East Derbyshire | 1,270.10 | 385,045.67 | 1.22 | 26.84 | 29.58 | 2.7 | 10.33 | 18.65 | 53.19 | 124 |
| Southend-on-Sea | 569.29 | 168,080.53 | 1.65 | 26.69 | 28.99 | 1.84 | 10.53 | 20.02 | 53.13 | 125 |
| Havant | 1,243.63 | 766,203.36 | 1.34 | 26.47 | 28.93 | 2 | 10.55 | 19.59 | 53.11 | 126 |
| Wigan | 735.99 | 322,962.14 | 1.98 | 26.75 | 29.45 | 2.87 | 10.29 | 18.72 | 53.07 | 127 |
| Coventry | 669.67 | 156,623.81 | 2.3 | 26.7 | 29.35 | 2.48 | 10.48 | 18.92 | 53.04 | 128 |
| Redditch | 753.07 | 694,655.01 | 1.49 | 26.61 | 29.23 | 2.48 | 10.47 | 19.08 | 53.03 | 129 |
| East Northamptonshire | 1,152.56 | 390,967.82 | 1.26 | 26.81 | 29.44 | 2.54 | 10.44 | 18.97 | 53 | 130 |
| Doncaster | 1,296.02 | 160,566.64 | 1.59 | 26.96 | 29.78 | 3.05 | 10.24 | 18.48 | 52.95 | 131 |
| Elmbridge | 753.41 | 237,327.44 | 1.72 | 26.61 | 29.08 | 2.01 | 10.52 | 19.54 | 52.93 | 132 |
| Portsmouth | 505 | 53,344.41 | 3.18 | 26.45 | 28.89 | 1.94 | 10.6 | 19.62 | 52.9 | 133 |
| Halton | 504.48 | 121,305.78 | 2.97 | 26.7 | 29.35 | 2.49 | 10.35 | 18.84 | 52.9 | 134 |
| Dover | 1,066.10 | 99,486.63 | 1.65 | 26.6 | 28.73 | 1.59 | 10.63 | 20.64 | 52.88 | 135 |
| North Warwickshire | 1,708.76 | 764,497.79 | 1.03 | 26.7 | 29.34 | 2.29 | 10.5 | 18.93 | 52.86 | 136 |
| Wellingborough | 1,182.88 | 243,446.99 | 1.96 | 26.74 | 29.38 | 2.47 | 10.43 | 19.02 | 52.86 | 137 |
| Solihull | 1,157.72 | 451,216.28 | 1.37 | 26.68 | 29.3 | 2.52 | 10.5 | 18.93 | 52.84 | 138 |
| Bournemouth, Christchurch and Poole | 649.95 | 98,626.10 | 2.18 | 26.36 | 28.84 | 1.98 | 10.61 | 19.59 | 52.8 | 139 |
| Bristol, City of | 333.55 | 203,488.36 | 4.38 | 26.42 | 28.94 | 2.12 | 10.5 | 19.48 | 52.78 | 140 |
| Hillingdon | 591.63 | 146,050.63 | 2.49 | 26.63 | 29.13 | 2.14 | 10.51 | 19.41 | 52.78 | 141 |
| Midlothian | 808.85 | 389,427.14 | 1.3 | 27.07 | 29.88 | 4.22 | 10.02 | 18.12 | 52.77 | 142 |
| Tamworth | 676.48 | 266,900.84 | 1.2 | 26.71 | 29.38 | 2.34 | 10.44 | 18.89 | 52.75 | 143 |
| Mole Valley | 890.31 | 174,185.85 | 1.84 | 26.61 | 29.03 | 1.94 | 10.55 | 19.69 | 52.71 | 144 |
| South Bucks | 983.29 | 386,316.16 | 1.56 | 26.62 | 29.15 | 2.18 | 10.51 | 19.37 | 52.71 | 145 |
| Reigate and Banstead | 677.76 | 125,070.09 | 2.46 | 26.62 | 29.05 | 2.03 | 10.55 | 19.63 | 52.67 | 146 |
| Warrington | 498.97 | 97,417.93 | 4.08 | 26.73 | 29.42 | 2.65 | 10.3 | 18.78 | 52.66 | 147 |
| Salford | 525.41 | 157,404.00 | 2.28 | 26.76 | 29.5 | 2.97 | 10.27 | 18.67 | 52.61 | 148 |
| Harrogate | 1,217.43 | 164,117.97 | 1.52 | 26.96 | 29.8 | 3.35 | 10.23 | 18.23 | 52.61 | 149 |
| Newark and Sherwood | 2,528.59 | 213,295.86 | 1.59 | 26.89 | 29.64 | 2.68 | 10.32 | 18.58 | 52.56 | 150 |
| Mansfield | 676.45 | 44,862.39 | 2.83 | 26.87 | 29.6 | 2.69 | 10.34 | 18.62 | 52.55 | 151 |
| Broxtowe | 714.99 | 145,918.73 | 1.38 | 26.83 | 29.58 | 2.61 | 10.32 | 18.66 | 52.48 | 152 |
| Staffordshire Moorlands | 1,422.11 | 286,580.55 | 1.7 | 26.76 | 29.45 | 2.66 | 10.39 | 18.81 | 52.47 | 153 |
| Redcar and Cleveland | 825.58 | 86,098.07 | 1.6 | 27.13 | 30.06 | 3.99 | 10.2 | 17.98 | 52.45 | 154 |
| North Norfolk | 1,986.47 | 493,679.23 | 1.31 | 26.93 | 29.31 | 2.4 | 10.51 | 19.7 | 52.43 | 155 |
| Corby | 838.03 | 295,732.05 | 1.24 | 26.79 | 29.43 | 2.55 | 10.42 | 18.94 | 52.39 | 156 |
| Scarborough | 1,633.54 | 75,440.98 | 2.76 | 27.17 | 30.05 | 3.83 | 10.19 | 18.16 | 52.36 | 157 |
| Welwyn Hatfield | 944.92 | 201,333.14 | 2.1 | 26.7 | 29.22 | 2.19 | 10.49 | 19.41 | 52.33 | 158 |
| Bolsover | 1,199.14 | 278,005.65 | 1.09 | 26.87 | 29.62 | 2.84 | 10.32 | 18.58 | 52.32 | 159 |
| Eastleigh | 713.92 | 248,595.81 | 1.93 | 26.46 | 28.93 | 2.1 | 10.56 | 19.51 | 52.31 | 160 |
| Guildford | 673.92 | 156,655.53 | 2.85 | 26.58 | 29.04 | 2.08 | 10.53 | 19.52 | 52.3 | 161 |
| Colchester | 1,479.16 | 421,832.90 | 1.16 | 26.74 | 29.06 | 1.85 | 10.52 | 19.92 | 52.22 | 162 |
| Hartlepool | 623.52 | 73,780.28 | 1.47 | 27.12 | 30.06 | 4.06 | 10.22 | 17.94 | 52.19 | 163 |
| King’s Lynn and West Norfolk | 2,256.45 | 366,221.01 | 1.44 | 26.92 | 29.44 | 2.43 | 10.38 | 19.28 | 52.18 | 164 |
| Uttlesford | 1,814.11 | 459,951.98 | 1.47 | 26.75 | 29.23 | 2.19 | 10.49 | 19.52 | 52.18 | 165 |
| Kettering | 1,077.54 | 204,025.32 | 1.67 | 26.78 | 29.41 | 2.58 | 10.46 | 18.96 | 52.16 | 166 |
| Bromsgrove | 1,301.41 | 603,225.58 | 1.24 | 26.62 | 29.24 | 2.53 | 10.52 | 18.98 | 52.07 | 167 |
| Gloucester | 659.09 | 144,719.26 | 1.69 | 26.51 | 29.08 | 2.12 | 10.55 | 19.22 | 52.05 | 168 |
| Tendring | 1,387.63 | 108,027.84 | 1.37 | 26.72 | 28.99 | 1.77 | 10.57 | 20.09 | 52.01 | 169 |
| York | 877.35 | 67,730.29 | 2.51 | 27.02 | 29.87 | 3.56 | 10.22 | 18.34 | 52 | 170 |
| Angus | 1,621.09 | 190,924.26 | 1.9 | 27.26 | 30.19 | 4.88 | 9.94 | 17.7 | 52 | 171 |
| Northampton | 931.89 | 220,911.95 | 1.44 | 26.73 | 29.35 | 2.47 | 10.48 | 19.06 | 51.89 | 172 |
| Basingstoke and Deane | 925.27 | 237,253.51 | 2.01 | 26.52 | 29.01 | 2.04 | 10.52 | 19.41 | 51.88 | 173 |
| Fife | 1,067.39 | 233,469.32 | 1.59 | 27.18 | 30.06 | 4.79 | 10 | 17.84 | 51.85 | 174 |
| Rochford | 1,059.11 | 234,542.06 | 1.09 | 26.69 | 29.02 | 1.89 | 10.55 | 19.93 | 51.85 | 175 |
| Stroud | 1,082.01 | 133,621.11 | 1.64 | 26.49 | 29.03 | 1.96 | 10.55 | 19.3 | 51.8 | 176 |
| Slough | 555.86 | 132,216.60 | 1.97 | 26.61 | 29.13 | 2.09 | 10.5 | 19.4 | 51.75 | 177 |
| Melton | 2,088.10 | 161,281.16 | 1.6 | 26.83 | 29.53 | 2.6 | 10.4 | 18.78 | 51.7 | 178 |
| Gravesham | 538.65 | 109,143.56 | 3.78 | 26.65 | 29.01 | 2.03 | 10.52 | 19.87 | 51.65 | 179 |
| North East Lincolnshire | 1,359.29 | 95,999.81 | 1.7 | 27.07 | 29.8 | 3.16 | 10.31 | 18.7 | 51.64 | 180 |
| Central Bedfordshire | 1,554.03 | 282,687.09 | 1.33 | 26.71 | 29.28 | 2.38 | 10.5 | 19.21 | 51.56 | 181 |
| Nuneaton and Bedworth | 936.1 | 127,665.26 | 1.44 | 26.72 | 29.36 | 2.3 | 10.49 | 18.91 | 51.53 | 182 |
| Canterbury | 743.31 | 39,106.55 | 2.57 | 26.63 | 28.8 | 1.64 | 10.6 | 20.46 | 51.47 | 183 |
| Chorley | 1,083.76 | 1,419,584.71 | 1.11 | 26.77 | 29.47 | 3.17 | 10.27 | 18.7 | 51.46 | 184 |
| East Hampshire | 1,399.74 | 423,070.31 | 1.36 | 26.51 | 28.97 | 2.06 | 10.55 | 19.51 | 51.42 | 185 |
| Swindon | 866.22 | 238,451.37 | 1.92 | 26.52 | 29.08 | 2.15 | 10.52 | 19.31 | 51.39 | 186 |
| Wirral | 455.5 | 132,499.09 | 3.19 | 26.68 | 29.31 | 2.76 | 10.33 | 18.99 | 51.38 | 187 |
| City of London | 233.87 | 2,460.22 | 10.72 | 26.66 | 29.11 | 2.06 | 10.51 | 19.59 | 51.35 | 188 |
| North Lincolnshire | 1,786.32 | 140,014.65 | 1.55 | 27.02 | 29.81 | 3.66 | 10.28 | 18.49 | 51.34 | 189 |
| Dorset | 1,807.83 | 328,094.27 | 1.37 | 26.32 | 28.76 | 2.08 | 10.64 | 19.64 | 51.34 | 190 |
| Oadby and Wigston | 688.32 | 101,175.68 | 1.59 | 26.78 | 29.44 | 2.47 | 10.4 | 18.89 | 51.25 | 191 |
| Bolton | 645.36 | 169,150.07 | 1.99 | 26.77 | 29.48 | 3.22 | 10.28 | 18.7 | 51.24 | 192 |
| Tunbridge Wells | 1,063.73 | 91,528.97 | 1.97 | 26.62 | 28.91 | 1.86 | 10.58 | 19.99 | 51.23 | 193 |
| Telford and Wrekin | 554.95 | 65,559.47 | 3.99 | 26.64 | 29.25 | 2.31 | 10.45 | 19.02 | 51.17 | 194 |
| Kirklees | 963.71 | 121,696.90 | 1.37 | 26.86 | 29.63 | 3.31 | 10.33 | 18.48 | 51.14 | 195 |
| Rochdale | 743.06 | 120,884.33 | 1.77 | 26.82 | 29.55 | 3.1 | 10.27 | 18.58 | 51 | 196 |
| Bradford | 740.29 | 92,138.86 | 1.59 | 26.9 | 29.71 | 3.45 | 10.21 | 18.37 | 50.98 | 197 |
| Swale | 1,084.36 | 98,106.98 | 1.85 | 26.65 | 28.9 | 1.67 | 10.55 | 20.15 | 50.95 | 198 |
| Preston | 740.5 | 201,053.55 | 1.63 | 26.77 | 29.47 | 3.23 | 10.29 | 18.71 | 50.79 | 199 |
| Worthing | 557.76 | 41,425.70 | 1.72 | 26.52 | 28.9 | 1.88 | 10.6 | 19.8 | 50.75 | 200 |
| Adur | 602.78 | 19,819.96 | 2.05 | 26.53 | 28.9 | 1.84 | 10.6 | 19.82 | 50.75 | 201 |
| Pendle | 638.1 | 59,115.98 | 2.01 | 26.84 | 29.6 | 3.37 | 10.31 | 18.49 | 50.72 | 202 |
| Tonbridge and Malling | 1,156.92 | 344,290.69 | 1.34 | 26.64 | 28.97 | 2.04 | 10.55 | 19.92 | 50.69 | 203 |
| Burnley | 566.61 | 40,472.98 | 2.98 | 26.83 | 29.59 | 3.24 | 10.27 | 18.52 | 50.65 | 204 |
| Cheshire East | 1,179.91 | 108,902.49 | 2.04 | 26.73 | 29.42 | 2.59 | 10.39 | 18.76 | 50.56 | 205 |
| Rugby | 1,412.00 | 237,751.44 | 1.48 | 26.71 | 29.33 | 2.78 | 10.49 | 18.99 | 50.54 | 206 |
| Sevenoaks | 1,791.54 | 367,090.49 | 1.83 | 26.65 | 29 | 2.05 | 10.53 | 19.81 | 50.53 | 207 |
| Wrexham | 1,027.94 | 276,721.76 | 2.3 | 26.62 | 29.22 | 2.57 | 10.41 | 19.12 | 50.45 | 208 |
| Ashford | 1,345.93 | 74,618.09 | 3.05 | 26.61 | 28.85 | 1.72 | 10.57 | 20.27 | 50.44 | 209 |
| Blackburn with Darwen | 777.87 | 161,426.35 | 1.86 | 26.78 | 29.5 | 3.37 | 10.28 | 18.67 | 50.42 | 210 |
| Dudley | 634.61 | 119,275.95 | 1.68 | 26.65 | 29.27 | 2.55 | 10.49 | 18.93 | 50.34 | 211 |
| Darlington | 963.25 | 67,643.55 | 1.46 | 27.05 | 29.97 | 3.78 | 10.18 | 17.99 | 50.33 | 212 |
| Scottish Borders | 2,811.93 | 185,662.98 | 2.25 | 27.03 | 29.88 | 4.09 | 10.05 | 18.04 | 50.31 | 213 |
| Malvern Hills | 1,855.05 | 124,175.18 | 2.63 | 26.54 | 29.15 | 2.27 | 10.53 | 19.14 | 50.29 | 214 |
| Huntingdonshire | 1,793.21 | 114,699.91 | 1.59 | 26.81 | 29.37 | 2.29 | 10.47 | 19.15 | 50.29 | 215 |
| Derbyshire Dales | 2,768.07 | 209,459.86 | 1.38 | 26.79 | 29.5 | 2.63 | 10.36 | 18.67 | 50.28 | 216 |
| Hyndburn | 497.19 | 46,778.09 | 2.38 | 26.81 | 29.56 | 3.12 | 10.26 | 18.55 | 50.25 | 217 |
| West Lancashire | 1,505.79 | 172,110.74 | 2.48 | 26.74 | 29.39 | 2.85 | 10.33 | 18.85 | 50.2 | 218 |
| East Staffordshire | 2,072.37 | 175,238.43 | 1.22 | 26.73 | 29.41 | 2.4 | 10.43 | 18.79 | 50.18 | 219 |
| South Ribble | 862.79 | 151,118.77 | 1.81 | 26.76 | 29.46 | 3.1 | 10.3 | 18.71 | 50.11 | 220 |
| Sefton | 540.13 | 93,461.31 | 2.96 | 26.7 | 29.33 | 2.86 | 10.34 | 18.9 | 50.11 | 221 |
| Lewes | 932.38 | 85,525.27 | 1.52 | 26.55 | 28.86 | 1.78 | 10.58 | 19.9 | 50.08 | 222 |
| Oldham | 696.2 | 77,852.11 | 1.72 | 26.82 | 29.55 | 3.09 | 10.29 | 18.59 | 50.04 | 223 |
| Folkestone and Hythe | 961.74 | 112,038.33 | 2.11 | 26.6 | 28.8 | 1.67 | 10.55 | 20.41 | 49.98 | 224 |
| Horsham | 2,133.44 | 265,526.31 | 1.04 | 26.54 | 28.95 | 2.04 | 10.61 | 19.71 | 49.94 | 225 |
| North West Leicestershire | 1,292.52 | 86,217.92 | 1.45 | 26.77 | 29.45 | 2.45 | 10.43 | 18.82 | 49.81 | 226 |
| Carlisle | 1,391.21 | 180,530.89 | 1.24 | 26.95 | 29.77 | 3.78 | 10.13 | 18.21 | 49.78 | 227 |
| East Suffolk | 1,292.30 | 76,468.32 | 1.68 | 26.77 | 29.06 | 1.75 | 10.51 | 20.14 | 49.72 | 228 |
| East Riding of Yorkshire | 1,721.17 | 50,262.48 | 1.56 | 27.07 | 29.9 | 3.55 | 10.27 | 18.35 | 49.64 | 229 |
| Trafford | 547.93 | 41,501.76 | 2.21 | 26.75 | 29.47 | 2.82 | 10.34 | 18.69 | 49.61 | 230 |
| Boston | 1,670.23 | 123,872.79 | 1.16 | 26.94 | 29.6 | 2.74 | 10.36 | 18.86 | 49.57 | 231 |
| South Gloucestershire | 922.48 | 143,752.08 | 1.88 | 26.43 | 28.96 | 2.02 | 10.52 | 19.46 | 49.56 | 232 |
| Calderdale | 880.13 | 70,111.43 | 1.71 | 26.86 | 29.63 | 3.28 | 10.25 | 18.52 | 49.55 | 233 |
| Wycombe | 957.05 | 64,994.29 | 2.59 | 26.63 | 29.18 | 2.25 | 10.51 | 19.31 | 49.54 | 234 |
| Caerphilly | 813.75 | 302,659.50 | 1.41 | 26.4 | 28.85 | 2.25 | 10.59 | 19.67 | 49.52 | 235 |
| Three Rivers | 854.96 | 67,245.01 | 2.19 | 26.66 | 29.19 | 2.34 | 10.52 | 19.33 | 49.48 | 236 |
| County Durham | 1,260.54 | 78,598.26 | 1.3 | 27.02 | 29.92 | 3.79 | 10.17 | 17.99 | 49.37 | 237 |
| Cotswold | 2,208.19 | 198,265.69 | 1.5 | 26.53 | 29.1 | 2.1 | 10.52 | 19.22 | 49.31 | 238 |
| North Hertfordshire | 1,329.76 | 121,627.76 | 1.27 | 26.74 | 29.32 | 2.26 | 10.48 | 19.21 | 49.29 | 239 |
| South Derbyshire | 1,212.18 | 55,659.97 | 1.73 | 26.77 | 29.45 | 2.53 | 10.44 | 18.79 | 49.28 | 240 |
| Cheltenham | 596.63 | 60,225.34 | 2.83 | 26.55 | 29.12 | 2.2 | 10.5 | 19.21 | 49.27 | 241 |
| Aberdeenshire | 3,661.50 | 158,639.10 | 1.13 | 27.33 | 30.37 | 4.55 | 9.83 | 17.41 | 49.26 | 242 |
| Woking | 815.13 | 122,287.01 | 1.52 | 26.58 | 29.04 | 2.08 | 10.53 | 19.52 | 49.22 | 243 |
| Worcester | 593.86 | 80,914.42 | 1.68 | 26.58 | 29.19 | 2.33 | 10.5 | 19.12 | 49.09 | 244 |
| Daventry | 1,888.16 | 235,361.99 | 1.26 | 26.72 | 29.35 | 2.6 | 10.46 | 19.05 | 49.05 | 245 |
| High Peak | 1,170.12 | 81,126.07 | 1.44 | 26.81 | 29.56 | 3.03 | 10.33 | 18.61 | 49.04 | 246 |
| Newport | 754.75 | 100,917.38 | 1.83 | 26.4 | 28.87 | 2.14 | 10.59 | 19.57 | 49 | 247 |
| Harrow | 660.52 | 73,384.25 | 1.89 | 26.66 | 29.19 | 2.12 | 10.46 | 19.4 | 48.94 | 248 |
| New Forest | 1,335.13 | 106,911.75 | 1.37 | 26.41 | 28.89 | 1.94 | 10.58 | 19.54 | 48.92 | 249 |
| Cherwell | 1,197.18 | 64,735.57 | 2.91 | 26.63 | 29.22 | 2.32 | 10.49 | 19.16 | 48.91 | 250 |
| Breckland | 2,215.78 | 91,765.62 | 1.36 | 26.88 | 29.36 | 2.19 | 10.48 | 19.48 | 48.88 | 251 |
| Herefordshire, County of | 1,877.43 | 106,184.54 | 2 | 26.49 | 29.06 | 2.15 | 10.55 | 19.28 | 48.88 | 252 |
| South Norfolk | 2,468.61 | 96,518.55 | 1.1 | 26.83 | 29.16 | 1.93 | 10.54 | 19.94 | 48.87 | 253 |
| Cardiff | 494.09 | 104,793.32 | 3.45 | 26.38 | 28.82 | 2.21 | 10.56 | 19.71 | 48.86 | 254 |
| West Oxfordshire | 1,536.02 | 165,115.94 | 2.09 | 26.57 | 29.14 | 2.29 | 10.46 | 19.17 | 48.82 | 255 |
| Falkirk | 547.23 | 135,597.92 | 2.68 | 26.99 | 29.59 | 4.41 | 9.97 | 18.75 | 48.82 | 256 |
| Maldon | 2,371.65 | 213,420.52 | 1.25 | 26.73 | 29.05 | 1.93 | 10.5 | 19.89 | 48.71 | 257 |
| West Lothian | 617.79 | 121,897.49 | 1.98 | 26.99 | 29.65 | 4.54 | 10.01 | 18.53 | 48.68 | 258 |
| Rossendale | 609.24 | 27,374.65 | 1.79 | 26.82 | 29.56 | 2.98 | 10.29 | 18.57 | 48.67 | 259 |
| West Berkshire | 1,322.67 | 183,849.30 | 2.58 | 26.54 | 29.07 | 2.27 | 10.48 | 19.32 | 48.65 | 260 |
| Babergh | 1,828.78 | 72,114.47 | 1.83 | 26.77 | 29.08 | 1.95 | 10.52 | 19.89 | 48.64 | 261 |
| Isle of Wight | 902.35 | 41,330.45 | 2.33 | 26.42 | 28.86 | 1.94 | 10.59 | 19.65 | 48.61 | 262 |
| Reading | 643.95 | 97,478.04 | 1.7 | 26.57 | 29.09 | 2.14 | 10.49 | 19.36 | 48.61 | 263 |
| Mid Sussex | 1,462.40 | 81,065.35 | 1.31 | 26.59 | 28.96 | 1.99 | 10.59 | 19.82 | 48.33 | 264 |
| Ribble Valley | 1,580.00 | 113,380.49 | 1.33 | 26.83 | 29.61 | 3.36 | 10.25 | 18.51 | 48.31 | 265 |
| Wolverhampton | 702.32 | 81,919.77 | 1.46 | 26.65 | 29.29 | 2.44 | 10.41 | 18.91 | 48.27 | 266 |
| Denbighshire | 2,144.03 | 1,761,586.56 | 1.27 | 26.61 | 29.14 | 2.79 | 10.39 | 19.26 | 48.13 | 267 |
| Glasgow City | 462.74 | 240,749.40 | 2.66 | 26.85 | 29.34 | 3.94 | 9.98 | 19.25 | 48.11 | 268 |
| Monmouthshire | 2,320.38 | 87,752.42 | 1.05 | 26.44 | 28.95 | 2 | 10.61 | 19.46 | 48.11 | 269 |
| South Kesteven | 1,790.56 | 50,856.09 | 1.71 | 26.88 | 29.57 | 2.74 | 10.33 | 18.83 | 48.04 | 270 |
| Blaby | 1,453.74 | 79,516.77 | 1.25 | 26.75 | 29.43 | 2.44 | 10.41 | 18.88 | 48.03 | 271 |
| Stratford-on-Avon | 2,418.27 | 174,994.56 | 1.56 | 26.63 | 29.24 | 2.64 | 10.5 | 19.1 | 48.02 | 272 |
| Lancaster | 943.56 | 34,594.13 | 3.07 | 26.81 | 29.58 | 3.41 | 10.22 | 18.54 | 47.83 | 273 |
| Fareham | 906.13 | 85,325.61 | 1.19 | 26.44 | 28.91 | 1.95 | 10.57 | 19.59 | 47.83 | 274 |
| Moray | 2,010.38 | 65,457.45 | 1.59 | 27.28 | 30.24 | 4.76 | 9.82 | 17.69 | 47.81 | 275 |
| Blackpool | 683.73 | 98,895.03 | 1.64 | 26.75 | 29.42 | 3.13 | 10.26 | 18.79 | 47.81 | 276 |
| Bassetlaw | 2,494.92 | 75,501.92 | 1.25 | 26.94 | 29.71 | 3.1 | 10.26 | 18.49 | 47.81 | 277 |
| South Staffordshire | 1,559.90 | 202,985.86 | 1.08 | 26.67 | 29.3 | 2.45 | 10.39 | 18.87 | 47.79 | 278 |
| North Lanarkshire | 705.42 | 344,781.38 | 2.67 | 26.89 | 29.44 | 4.27 | 9.96 | 18.99 | 47.79 | 279 |
| South Northamptonshire | 2,395.83 | 245,644.20 | 1.01 | 26.69 | 29.29 | 2.55 | 10.52 | 19.15 | 47.72 | 280 |
| Vale of White Horse | 1,554.82 | 119,136.38 | 1.69 | 26.56 | 29.12 | 2.24 | 10.5 | 19.22 | 47.67 | 281 |
| Wyre Forest | 770 | 63,549.99 | 2.34 | 26.6 | 29.21 | 2.52 | 10.48 | 19.05 | 47.59 | 282 |
| Mid Suffolk | 2,631.96 | 143,312.61 | 1.03 | 26.79 | 29.11 | 1.9 | 10.52 | 19.89 | 47.56 | 283 |
| Merthyr Tydfil | 804.94 | 205,264.05 | 1.4 | 26.41 | 28.86 | 2.32 | 10.59 | 19.75 | 47.49 | 284 |
| Vale of Glamorgan | 924.78 | 178,765.86 | 2.5 | 26.36 | 28.76 | 2.13 | 10.56 | 19.84 | 47.47 | 285 |
| West Lindsey | 2,996.33 | 126,658.39 | 1.2 | 27 | 29.78 | 3.9 | 10.28 | 18.55 | 47.43 | 286 |
| South Oxfordshire | 1,400.16 | 128,081.99 | 1.41 | 26.6 | 29.13 | 2.25 | 10.49 | 19.28 | 47.4 | 287 |
| Harborough | 2,824.14 | 101,857.95 | 1.15 | 26.79 | 29.46 | 2.48 | 10.42 | 18.84 | 47.34 | 288 |
| Allerdale | 1,642.46 | 281,688.06 | 1.31 | 26.82 | 29.5 | 3.75 | 10.11 | 18.7 | 47.28 | 289 |
| Chiltern | 964.02 | 69,930.23 | 1.61 | 26.66 | 29.21 | 2.38 | 10.49 | 19.32 | 47.25 | 290 |
| Eden | 2,642.09 | 134,511.99 | 1.1 | 26.9 | 29.69 | 3.59 | 10.2 | 18.27 | 47.24 | 291 |
| Torfaen | 772.44 | 87,093.06 | 1.29 | 26.42 | 28.9 | 2.19 | 10.6 | 19.6 | 47.21 | 292 |
| Wychavon | 1,281.47 | 41,341.89 | 2.14 | 26.57 | 29.16 | 2.43 | 10.53 | 19.1 | 47.2 | 293 |
| East Lindsey | 2,896.78 | 79,699.24 | 1.09 | 27.02 | 29.69 | 3.02 | 10.37 | 18.84 | 47.01 | 294 |
| Wiltshire | 1,542.81 | 152,315.66 | 1.41 | 26.45 | 28.98 | 2.08 | 10.52 | 19.43 | 46.91 | 295 |
| Winchester | 2,104.08 | 213,545.03 | 1.45 | 26.47 | 28.93 | 2.1 | 10.52 | 19.53 | 46.84 | 296 |
| South Cambridgeshire | 2,410.42 | 146,175.57 | 1.1 | 26.79 | 29.32 | 2.29 | 10.38 | 19.32 | 46.81 | 297 |
| North Kesteven | 2,174.40 | 47,795.08 | 1.08 | 26.93 | 29.65 | 2.75 | 10.35 | 18.73 | 46.7 | 298 |
| Wyre | 1,090.53 | 91,838.90 | 1.37 | 26.79 | 29.51 | 3.31 | 10.24 | 18.69 | 46.67 | 299 |
| Selby | 2,490.52 | 43,283.51 | 1.2 | 26.97 | 29.78 | 3.22 | 10.26 | 18.42 | 46.64 | 300 |
| Flintshire | 1,671.48 | 192,039.17 | 1.59 | 26.64 | 29.2 | 2.79 | 10.38 | 19.14 | 46.53 | 301 |
| Chichester | 3,074.99 | 198,401.94 | 1.43 | 26.52 | 28.94 | 2.02 | 10.53 | 19.6 | 46.39 | 302 |
| Test Valley | 1,249.07 | 133,611.83 | 1.31 | 26.47 | 28.95 | 2.16 | 10.54 | 19.48 | 46.33 | 303 |
| Broadland | 2,010.10 | 113,386.67 | 1.05 | 26.89 | 29.27 | 2.3 | 10.5 | 19.74 | 46.28 | 304 |
| Richmondshire | 2,551.04 | 38,078.99 | 1.36 | 26.96 | 29.81 | 3.61 | 10.23 | 18.16 | 46.23 | 305 |
| East Cambridgeshire | 3,348.47 | 58,945.44 | 1.39 | 26.84 | 29.36 | 2.21 | 10.44 | 19.33 | 46.15 | 306 |
| Arun | 1,140.84 | 48,069.67 | 1.55 | 26.5 | 28.9 | 1.93 | 10.54 | 19.69 | 46.03 | 307 |
| East Hertfordshire | 2,729.43 | 83,824.90 | 1.2 | 26.73 | 29.25 | 2.11 | 10.47 | 19.39 | 46.02 | 308 |
| Barrow-in-Furness | 1,019.33 | 83,815.66 | 1.7 | 26.77 | 29.41 | 3.36 | 10.23 | 18.8 | 45.81 | 309 |
| Torbay | 540.81 | 75,951.20 | 4.15 | 26.21 | 28.49 | 1.82 | 10.53 | 20.23 | 45.76 | 310 |
| Blaenau Gwent | 999.89 | 120,366.09 | 1.22 | 26.41 | 28.86 | 2.29 | 10.59 | 19.67 | 45.7 | 311 |
| South Lakeland | 1,873.25 | 73,010.09 | 1.26 | 26.83 | 29.58 | 3.3 | 10.21 | 18.54 | 45.59 | 312 |
| North Somerset | 1,407.54 | 105,658.51 | 1.74 | 26.4 | 28.89 | 2.12 | 10.54 | 19.53 | 45.52 | 313 |
| Braintree | 1,074.59 | 50,362.63 | 1.17 | 26.76 | 29.15 | 2.05 | 10.49 | 19.72 | 45.51 | 314 |
| Clackmannanshire | 955.62 | 105,000.51 | 1.75 | 27.01 | 29.67 | 4.38 | 9.87 | 18.68 | 45.42 | 315 |
| Tandridge | 1,127.90 | 74,861.35 | 1.6 | 26.62 | 29.01 | 2.1 | 10.52 | 19.79 | 45.36 | 316 |
| Bath and North East Somerset | 934.92 | 33,793.59 | 2.3 | 26.42 | 28.93 | 2.15 | 10.55 | 19.48 | 45.32 | 317 |
| Rhondda Cynon Taf | 1,326.67 | 227,815.42 | 1.28 | 26.38 | 28.81 | 2.27 | 10.56 | 19.78 | 45.26 | 318 |
| Hambleton | 2,474.41 | 23,732.14 | 1.09 | 27.03 | 29.9 | 3.51 | 10.17 | 18.14 | 45.16 | 319 |
| Shropshire | 3,343.63 | 117,874.39 | 1.21 | 26.6 | 29.19 | 2.34 | 10.49 | 19.07 | 45.06 | 320 |
| Craven | 2,328.84 | 29,107.92 | 1.43 | 26.88 | 29.7 | 3.49 | 10.19 | 18.38 | 45.05 | 321 |
| South Lanarkshire | 925.98 | 164,054.06 | 1.84 | 26.89 | 29.48 | 4.58 | 10 | 18.88 | 44.83 | 322 |
| Forest of Dean | 3,260.49 | 88,658.05 | 1.02 | 26.47 | 29.03 | 2.04 | 10.55 | 19.3 | 44.8 | 323 |
| Stirling | 1,081.53 | 137,595.52 | 3.07 | 26.9 | 29.38 | 4.03 | 9.97 | 19.28 | 44.76 | 324 |
| Fylde | 1,280.60 | 60,433.25 | 1.19 | 26.75 | 29.41 | 3.05 | 10.32 | 18.8 | 44.37 | 325 |
| Ryedale | 2,721.73 | 53,787.70 | 1.02 | 27.1 | 29.97 | 4.1 | 10.18 | 18.19 | 44.05 | 326 |
| Exeter | 520.92 | 73,947.37 | 2.41 | 26.24 | 28.55 | 1.79 | 10.48 | 20.1 | 43.96 | 327 |
| Perth and Kinross | 2,367.33 | 118,485.15 | 1.45 | 27.07 | 29.73 | 4.49 | 9.86 | 18.61 | 43.93 | 328 |
| Renfrewshire | 865 | 483,575.91 | 1.79 | 26.72 | 29.14 | 3.88 | 9.99 | 19.53 | 43.91 | 329 |
| Sedgemoor | 2,211.18 | 88,256.30 | 1.43 | 26.34 | 28.79 | 2.03 | 10.56 | 19.7 | 43.75 | 330 |
| Tewkesbury | 1,808.31 | 44,616.87 | 1.11 | 26.53 | 29.1 | 2.19 | 10.52 | 19.22 | 43.56 | 331 |
| Fenland | 4,058.79 | 44,719.63 | 1.05 | 26.88 | 29.46 | 2.46 | 10.39 | 19.1 | 43.39 | 332 |
| East Devon | 1,524.70 | 79,616.16 | 1.6 | 26.26 | 28.64 | 1.84 | 10.54 | 19.99 | 43.35 | 333 |
| East Renfrewshire | 764.7 | 1,040,042.51 | 1.78 | 26.67 | 29.08 | 3.88 | 9.97 | 19.53 | 43.31 | 334 |
| Aylesbury Vale | 2,712.50 | 115,524.37 | 1.01 | 26.67 | 29.25 | 2.64 | 10.5 | 19.2 | 43.29 | 335 |
| South Holland | 2,362.76 | 15,907.42 | 1.04 | 26.9 | 29.52 | 2.62 | 10.38 | 19.01 | 43.12 | 336 |
| Mid Devon | 2,582.80 | 275,401.45 | 1.31 | 26.25 | 28.54 | 1.89 | 10.53 | 20.11 | 42.88 | 337 |
| South Somerset | 2,726.87 | 173,601.30 | 1.36 | 26.32 | 28.78 | 2.09 | 10.54 | 19.75 | 42.47 | 338 |
| Bridgend | 1,996.81 | 345,488.07 | 1.14 | 26.35 | 28.73 | 2.23 | 10.54 | 19.9 | 42.43 | 339 |
| North Ayrshire | 1,338.43 | 620,508.60 | 1.56 | 26.7 | 29.09 | 3.62 | 10.04 | 19.7 | 42.16 | 340 |
| Teignbridge | 1,568.86 | 184,357.07 | 1.5 | 26.23 | 28.49 | 1.92 | 10.52 | 20.24 | 42.05 | 341 |
| Mendip | 1,797.98 | 52,496.32 | 1.26 | 26.37 | 28.86 | 2.16 | 10.55 | 19.56 | 41.7 | 342 |
| West Dunbartonshire | 570.72 | 78,736.46 | 2.47 | 26.79 | 29.22 | 3.85 | 9.96 | 19.55 | 41.11 | 343 |
| Swansea | 860.22 | 289,276.34 | 1.97 | 26.36 | 28.66 | 2.54 | 10.48 | 20.13 | 41.08 | 344 |
| East Dunbartonshire | 952.78 | 86,384.95 | 1.91 | 26.85 | 29.32 | 4.06 | 9.97 | 19.28 | 40.99 | 345 |
| East Ayrshire | 1,603.88 | 79,194.74 | 2.39 | 26.74 | 29.23 | 3.53 | 10.06 | 19.47 | 40.9 | 346 |
| Powys | 3,519.92 | 84,321.97 | 1.21 | 26.49 | 28.97 | 2.46 | 10.54 | 19.55 | 40.46 | 347 |
| Shetland Islands | 14,340.80 | 14,353.63 | 1.03 | 27.93 | 31.68 | 6.37 | 9.63 | 15.22 | 40.2 | 348 |
| Copeland | 1,717.74 | 67,127.26 | 1.06 | 26.78 | 29.38 | 3.96 | 10.21 | 18.85 | 39.93 | 349 |
| Orkney Islands | 4,831.59 | 6,673.18 | 1.03 | 27.49 | 30.68 | 5.05 | 9.64 | 17 | 39.7 | 350 |
| Gwynedd | 3,338.97 | 229,155.27 | 1.25 | 26.56 | 28.97 | 2.98 | 10.46 | 19.67 | 39.67 | 351 |
| North Devon | 1,597.83 | 64,604.27 | 1.62 | 26.28 | 28.5 | 1.92 | 10.52 | 20.24 | 39.37 | 352 |
| South Ayrshire | 1,758.50 | 87,039.56 | 3.16 | 26.68 | 29.02 | 2.91 | 10.21 | 19.9 | 39.14 | 353 |
| Somerset West and Taunton | 1,630.18 | 49,539.47 | 1.1 | 26.29 | 28.67 | 2.03 | 10.54 | 19.9 | 38.66 | 354 |
| Neath Port Talbot | 1,444.60 | 93,046.24 | 1.32 | 26.36 | 28.71 | 2.37 | 10.53 | 20.01 | 38.49 | 355 |
| Dumfries and Galloway | 2,663.71 | 16,035.12 | 2.49 | 26.76 | 29.26 | 3.56 | 10.11 | 19.28 | 38.15 | 356 |
| Plymouth | 747.64 | 159,891.82 | 2.84 | 26.2 | 28.29 | 2.16 | 10.48 | 20.72 | 37.86 | 357 |
| Inverclyde | 922.11 | 67,481.98 | 1.92 | 26.68 | 29.07 | 3.65 | 10.04 | 19.65 | 37.1 | 358 |
| West Devon | 3,872.31 | 384,626.78 | 1.11 | 26.23 | 28.35 | 2.01 | 10.49 | 20.57 | 36.89 | 359 |
| Highland | 4,757.99 | 56,073.32 | 2.06 | 27.05 | 29.59 | 4.96 | 9.83 | 19.12 | 36.68 | 360 |
| Conwy | 2,048.30 | 41,054.30 | 1.24 | 26.58 | 29.01 | 2.85 | 10.41 | 19.56 | 36.61 | 361 |
| Torridge | 3,344.44 | 413,780.88 | 1.07 | 26.25 | 28.38 | 2.11 | 10.48 | 20.55 | 35.74 | 362 |
| Isle of Anglesey | 3,585.09 | 264,585.94 | 1.03 | 26.55 | 28.86 | 2.85 | 10.45 | 20.03 | 35.7 | 363 |
| South Hams | 2,454.41 | 20,482.78 | 1.11 | 26.19 | 28.37 | 1.89 | 10.53 | 20.53 | 34.18 | 364 |
| Carmarthenshire | 2,825.02 | 220,525.35 | 1.06 | 26.38 | 28.63 | 2.58 | 10.49 | 20.29 | 34.16 | 365 |
| Argyll and Bute | 4,442.93 | 139,780.34 | 1.19 | 26.62 | 28.96 | 3.52 | 10.06 | 19.85 | 31.96 | 366 |
| Cornwall | 2,226.29 | 108,522.94 | 1.35 | 26.19 | 28.06 | 2.44 | 10.49 | 21.23 | 29.83 | 367 |
| Ceredigion | 3,908.46 | 7,740.25 | 1 | 26.47 | 28.81 | 2.41 | 10.49 | 19.96 | 28.84 | 368 |
| Pembrokeshire | 2,265.59 | 52,647.23 | 1.08 | 26.33 | 28.34 | 2.45 | 10.47 | 20.92 | 28.17 | 369 |
| Isles of Scilly | 762.77 | 9,941.10 | 1.55 | 26.02 | 27.13 | 2.5 | 10.36 | 23.29 | 24.07 | 370 |
| Na h-Eileanan Siar | 4,998.41 | 17,445.60 | 1.44 | 26.72 | 28.59 | 4.61 | 9.81 | 20.91 | 18.06 | 371 |


